The Australian Energy Market Operator’s (AEMO) Quarterly Energy Dynamics (QED) report for Q4, 2020, has found, among a range of significant findings, that the final quarter of 2020 was a key moment for several major trends in the National Electricity Market (NEM).
Demand has dropped to notable new lows, driven only partly by the impacts of COVID19. AEMO’s Chief Member Services Officer, Violette Mouchaileh, says that “Electricity demand continues to reflect changing energy trends with new minimum demand records observed in Victoria, South Australia, and Western Australia”. This trend, paired with increasing renewable energy, resulted in the lowest emissions quarter on record, due to the displacement of thermal generation like coal and gas.
Gas, in particular, saw a drop related to an increase in gas prices that were linked to international trends, whereby mild recovery from COVID19 has led to increased competition for fuel supplies. “The increase in gas prices reversed the downward trend that commenced in 2019 and was largely influenced by LNG prices that are linked to international oil prices,” Ms Mouchaileh said.
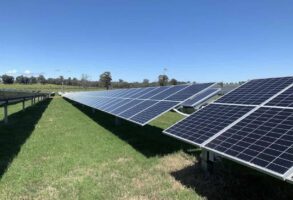
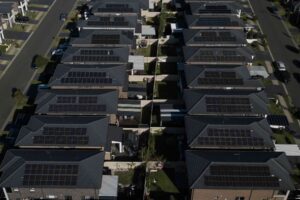
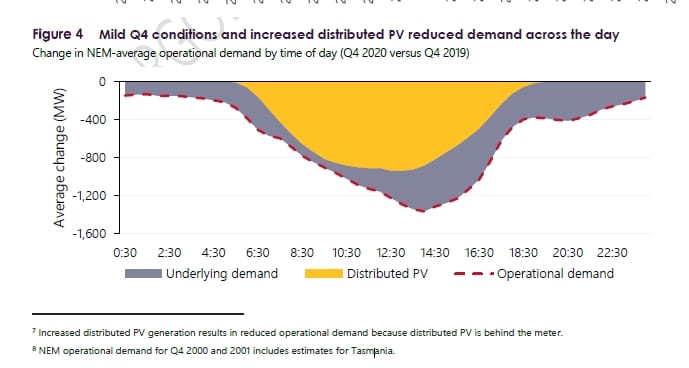
AEMO highlights the important role that rooftop solar is playing in reducing demand levels across Australia’s two main grids (the National Electricity Market, NEM and the Western Electricity Market, WEM). In fact, the majority of the reduction in demand comes from greater deployment of rooftop solar, rather than reductions in electricity usage.
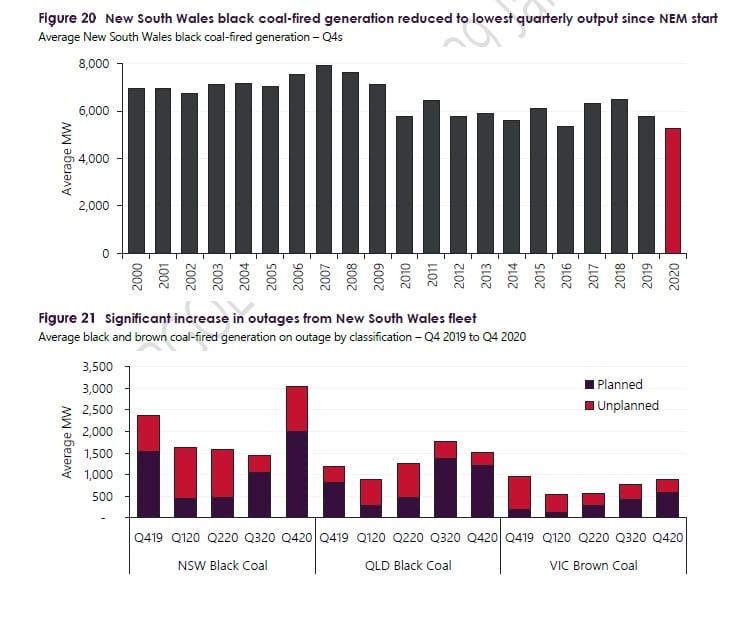
As these grid dynamics change, there is a flow-on effect through pricing outcomes within these grids. For instance, on the 17th of December 2020, outages at the Liddell coal-fired power station resulted in dispatch price in New South Wales spiking to $14,000 / MWh for 55 minutes. Outages at coal-fired power stations in NSW were both planned and unplanned, but together have increased significantly, resulting in the lowest Q4 quantity of coal output in the state since the commencement of the NEM.
 In addition to this, Queensland solar farms saw a sudden drop of 590 megawatts when system strength constraints were applied on the 13th of October, 2020. The sudden loss of demand contributed to a brief price spike of $15,000 / MWh. The mixture of high wind and solar output, low demand and grid constraints also contributed to record low negative spot prices occurrences in South Australia and Victoria (this occurs when generation is over-supplied, and the market price dis-incentivises generation).
Newer Victorian wind and solar farms have become significantly more responsive to these fluctuations in price. Some older wind farms are listed in a way that makes them unable to respond to grid operator dispatch targets, but some are listed as ‘semi-scheduled’, which means if they submit bids to offer energy at a price higher than the current one, they are issued commands to stop generating by AEMO.
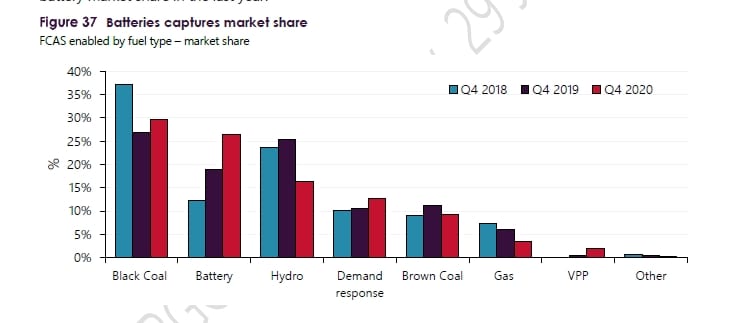
This is classified as ‘economic curtailment’, and results in more responsive and flexible generation. Brown coal units began ramping up flexibly too, and even gas-fired power was ordered to stay on after it bid out during negative price events. But the revenue to battery systems increased due to these negative price events – they’re paid money to charge up from the grid, and they then discharge it when prices are positive again. In fact, batteries have captured the 2nd highest market share in power system management:
The report highlights the growth of a grid that is in a state of flux. Gas power also reached its lowest Q4 generation level since 2005, attributed partly to record high wind and solar generation (in addition to low demand and fewer coal outages in Victoria). Alongside that, wind and solar output hit 14% of NEM generation for the full year of 2020, an increase of 4.3 terawatt hours. AEMO says two new records were broken:
- Highest grid-scale VRE share of NEM operational demand – NEM VRE output met 36% of NEM operational demand at 0930 hrs on 3 October 2020
- Highest grid-solar output on record – NEM grid-solar output reached 3,210 MW at 1230 hrs on 30 November 2020
Many of these trends are likely to continue into 2021, and manifest in strange new ways as demand begins to shift again during the COVID19 recovery process into the latter half of the year.
See also:
“World first:” South Australia achieves 100pct solar, and lowest prices in Australia
Solar and wind farms – and even some coal units – learn to dodge negative prices