Renewables delivered a record 35.4 per cent share of generation on Australia’s main grid in the month of September, one of many new benchmarks set in this transformative spring, and underlining the accelerating pace of the energy transition.
The fact that a record share is set in September is not surprising, given that temperatures are usually mild and demand relatively low, and “instantaneous” levels of renewables have been hitting record highs (61.7 per cent), and pushing minimum demand and coal generation down to record lows.
The new monthly record for renewables is well above the same month last year (30.7 per cent), and has lifted the 12-month average of renewables to above 30 per cent (30.1 per cent) for the first time, according to Dylan McConnell, an energy expert from the Climate and Energy College in Melbourne.
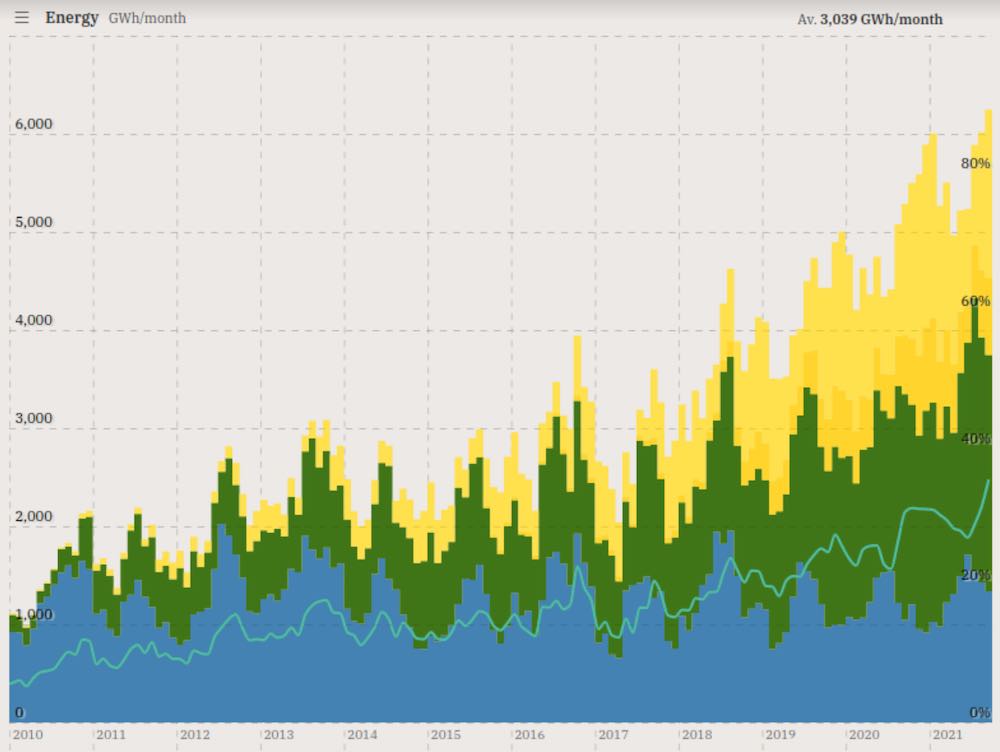
September also saw a new record for VRE (variable renewable energy, or just wind and solar), with a 28 per cent share over the month. Wind was the biggest contributor with 13.6 per cent of total generation, followed by rooftop solar with 9.7 per cent and utility scale solar with 4.4 per cent.
This graph below shows the jump in both aggregate output of wind and solar, and the share of renewables in terms of total generation. Wind and solar are the clearly the big movers. Hydro power is largely unchanged.
See also the other news from today: Rooftop solar PV smashes generation record on main grid
The share of renewables in September would have been substantially higher, were it not for the hight level of constraints over the month. Much of it was voluntary – switching off to dodge the record number of negative pricing events – and some of it was imposed, due to grid bottlenecks and other network issues.
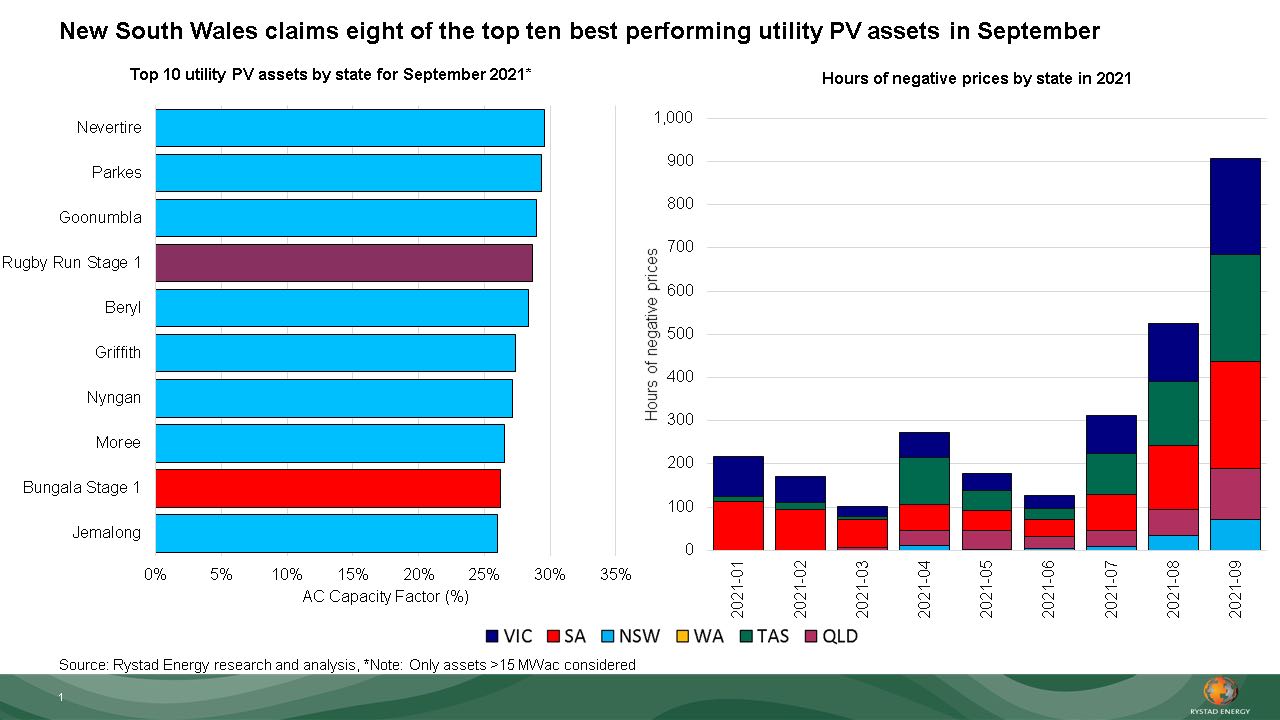
According to David Dixon, from energy analysts Rystad, the number of negative pricing events nearly doubled from the previous month to a record high of more than 900 hours.
Many wind and solar farms are obliged, by their contracts, to switch off when prices are negative. Prices are usually bid below zero because coal generators do not want to be switched off, and are willing to pay for the privilege of maintaining production.
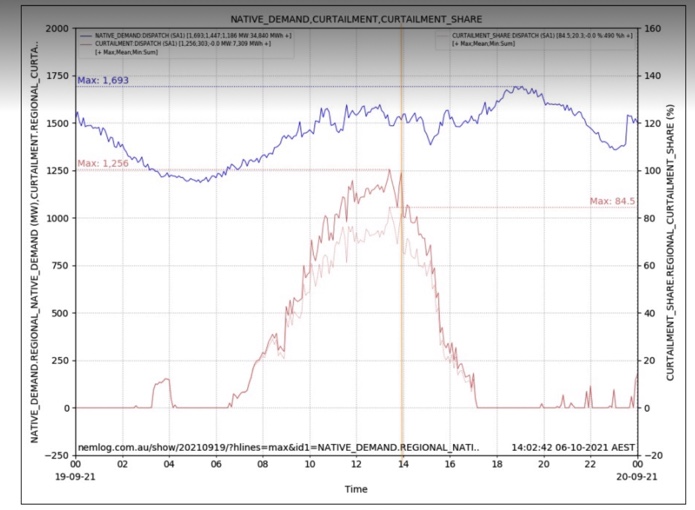
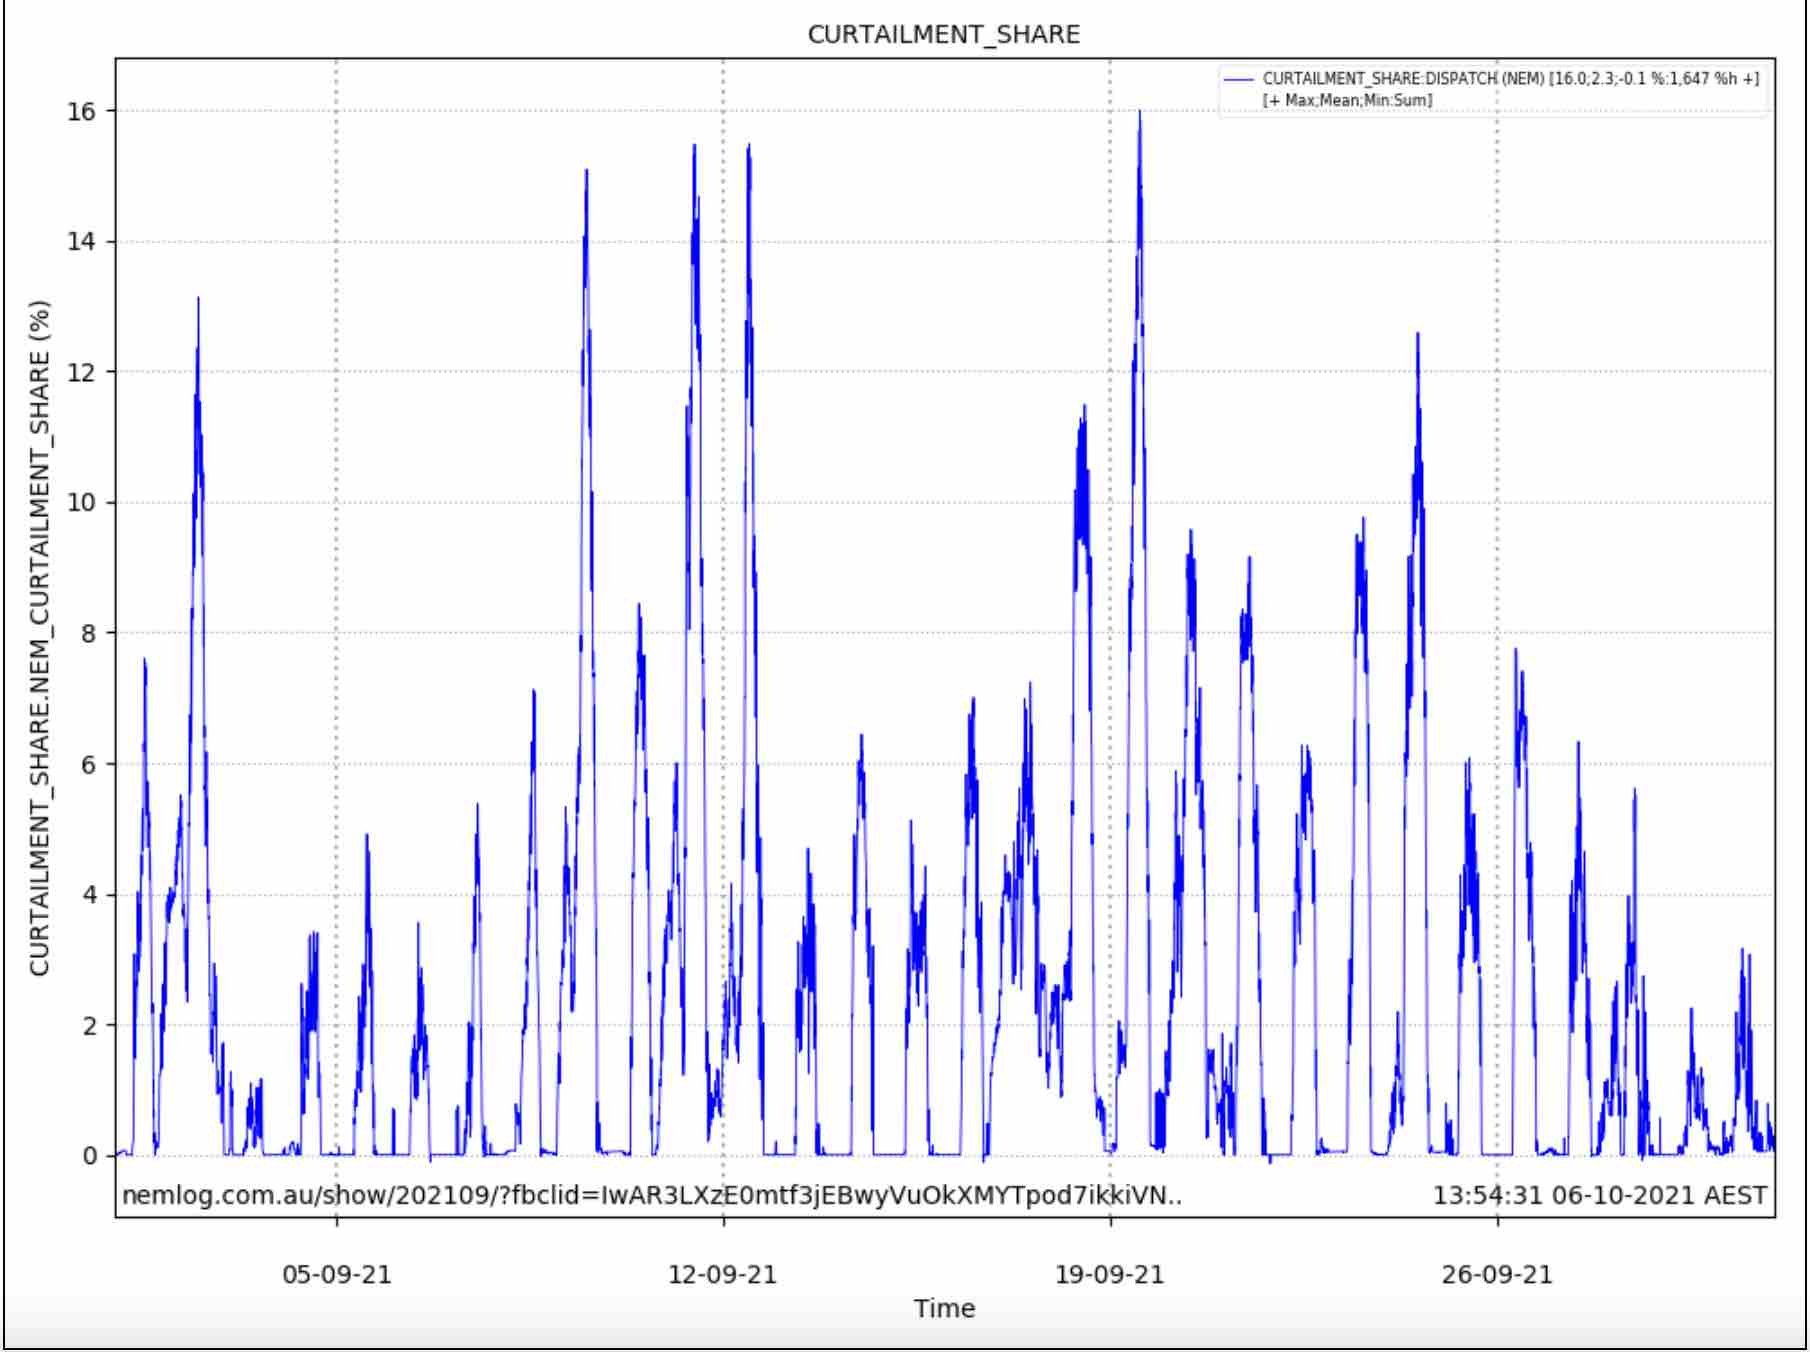
According to another energy analyst, Geoff Eldridge from NEMLog, the average curtailment of large scale wind and solar in the NEM in September was 2.3 per cent, peaking at 16 per cent at 12.50pm on Sunday, September 19.
On that same day, the level of curtailment of large scale wind and solar in South Australia reached a massive 84.5 per cent at 1.25pm (see graph at bottom), mostly because demand was low and rooftop solar left little room for the large scale renewables.
That should be a clear signal for more storage, although the new $2.3 billion transmission link to NSW will allow for more exports and alleviate the problem.
Not every wind and solar plant needs to switch off for negative pricing events, however, and some are lucky enough to be sited in states with little curtailment.
Rystad’s Dixon notes that eight of the top ten utility solar PV assets for the month were all located in New South Wales, which had few negative pricing events and little economic curtailment.
The best performing asset for the month (see the middle table above), was Elliot Green Power’s Nevertire solar farm (29.5 % AC capacity factopr), followed by Neoen’s Parkes solar farm (29.3% AC CF) and FRV’s Goonumbla (29.0% AC CF).
The only two assets outside of NSW to make the top 10 were Adani’s Rugby Run Stage 1 (28.7% AC CF) in Queensland, and Enel/DIF’s Bungala stage 1 (26.0% AC CF) in South Australia, which is an interesting achievement given it is in the state with the most curtailment.
According to Dixon’s data, NSW generated the most large scale solar power with 327GWh in the month, followed by Queensland at 243GWh.
For wind generation, John Laing and Windlab’s Kiata wind farm in Victoria was the top performing asset in September (52.4% AC CF), followed by EGCO’s Boco Rock wind farm in NSW (51.0% AC CF).