Australia’s 2,500MW of wind farms run at nearly 50 per cent capacity during the month of July – meaning that they produced more electricity as a percentage of their capacity than some coal-fired power stations, and more than twice as much as many gas-fired generators.
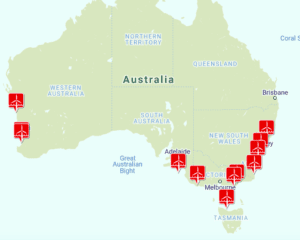
As we reported last week, July was a big month for renewable energy. In South Australia, wind energy provided 43 per cent of the state’s total demand over the month. With the addition of rooftop solar, that means that nearly half the state’s electricity needs came from variable renewable energy sources.
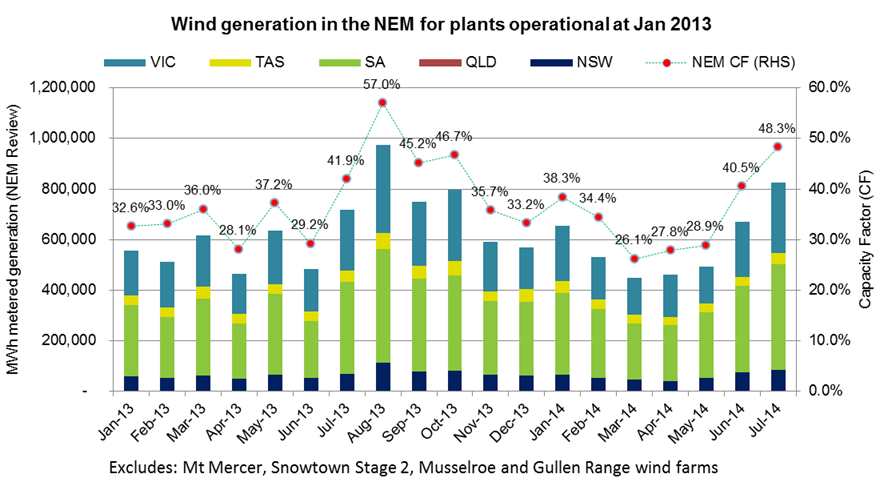
But wind energy was having an impact across the country. The first graph from Green Energy Markets shows the amount of output from Australia’s wind farms in the month of July. It turns out to be a record amount, thanks mostly to the new wind farms that joined in the past year, particularly the recently completed Snowtown II facility in South Australia.

However, the second graph, also from GEM, shows the average capacity factor of wind energy across the NEM, adjusted for those wind farms which were operating since early 2013, and not including smaller wind farms whose output is not captured so readily by the Australian Energy Market Operator.
It shows that the capacity factor of wind energy across the NEM was 48.3 per cent, although this is not the highest – last August those same wind farms operated at a capacity factor of 57 per cent.