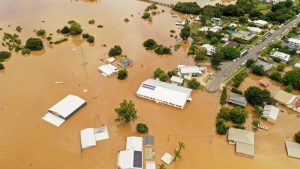
The latest quarterly update of Australia’s National Greenhouse Gas Inventory from DCCEEW is out, it’s a great opportunity to check in on the country’s climate progress.
The topline figure from this quarterly update is that national emissions fell by 1.9% between September 2024 and September 2025. For those people who wear the 1% t-shirts and believe in incremental progress, this is certainly more than nothing.
But it’s nowhere near the pace of change needed to meet even our 2030 emissions reductions pledges, let alone our newest 2035 targets. Infact, we released 400kt of Co2-e more in the 12 months to September 2025, than we did in 2021.
Using the September quarter as a like-for-like comparison with our 2005 baseline, Australia’s emissions “back then” were estimated to be 162 Mt CO2-e. By comparison, in the last September quarter we were tracking at 111.7 Mt of CO2-e, representing a 31% reduction on the quarter.
What 2030 actually requires
Australia’s short-term target, set back in Albanese’s first euphoric term, is to achieve a 43% reduction below 2005 levels, by the end of the decade. To achieve that by the September quarter of 2030, we’d need to reduce our quarterly emissions to roughly 92 Mt CO2‑e.
To achieve that from today’s levels (112 Mt/quarter), we’ve got to cut our emissions from today’s levels by about 18% over the next five years. We should be comforted in knowing that we’re a little over half-way towards the 2030 targets, but our required annual reduction rate is now closer to 3.9% per year. This is over twice the rate of current emissions reductions (1.9%).
This isn’t as fast as the stated 4.9% reductions required by the reformed Safeguard Mechanism. However, as any RenewEconomy reader should know, most of the economy, including agriculture, transport, and households, sits outside the scheme.
While this may change following this year’s Safeguard Review, the government has so far resisted recommendations to even estimate the emissions from big farms, let alone incorporate these likely significant emitters under the scheme’s umbrella.
But let’s also not pretend that the Safeguard Mechanism is performing as intended. Across Safeguard-covered sectors, such as coal, gas and industrial sites, emissions are not yet falling anywhere near the boilerplate 4.9% emissions rate.
And 2035 is steeper again
This brings me to the updated and even more ambitious 2035 targets, of a 62–70% reduction. On a quarterly basis, this would mean that the quarterly emissions for September 2035 would need to fall to between 62 – 49Mt CO2‑e.
That means roughly halving emissions again within the next decade. It also implies achieving sustained annual reductions of between 5.8 and 7% per year.
This reality isn’t reflected in the quarterly update, and likely won’t make it into any significant political speech this year, but should be a reality faced head on in the budget, or this year’s Safeguard Mechanism review.
Electricity is decarbonising, but coal still dominates
The largest absolute reduction over the year came from the electricity sector, which shed 4.8 Mt CO2e compared to the same period the year before. This is being led across the National Electricity Market (NEM), where emissions fell by 3.7% over the year.
This decline is being driven by renewables, which supplied 42% of the NEM’s electricity in the year to September. But let’s not pretend that coal didn’t also contribute 53.2% of the NEM’s electricity, with gas making up the remaining 4.8%. The system is decarbonising from a very high baseline, only a decade ago, coal powered 77% of Australia’s electricity demand.
Continuing on this trend represents both a challenge, but it is also a critical opportunity, and makes up the lion’s share of the government’s expected emissions reductions over the next decade.
Fugitive emissions fell fast, but is it sustainable?
Believe it or not, the electricity sector didn’t record the highest rate of decarbonisation over the last year. That prize fell to the energy sector’s “fugitive emissions,” largely escaping from coal mines and gas wells. While not the largest emitting sector, fugitive emissions fell 3.8% in the 12 months to September.
Unfortunately, this swing sector didn’t decarbonise due to technological innovation, but because of production shifts and accidents that could just as easily reverse. In gas, emissions fell 2.7%, almost exactly tracking LNG and natural gas production declines of 2.6–2.7%. Those production declines are not expected to persist.
The inventory also counts emissions reductions attributed to carbon capture and storage, likely linked to early performance at Santos’ Moomba project. This project has already smashed annual carbon credit records and has significant expansion opportunities to come. However, it remains an early-stage project and is yet to be stress tested over time.
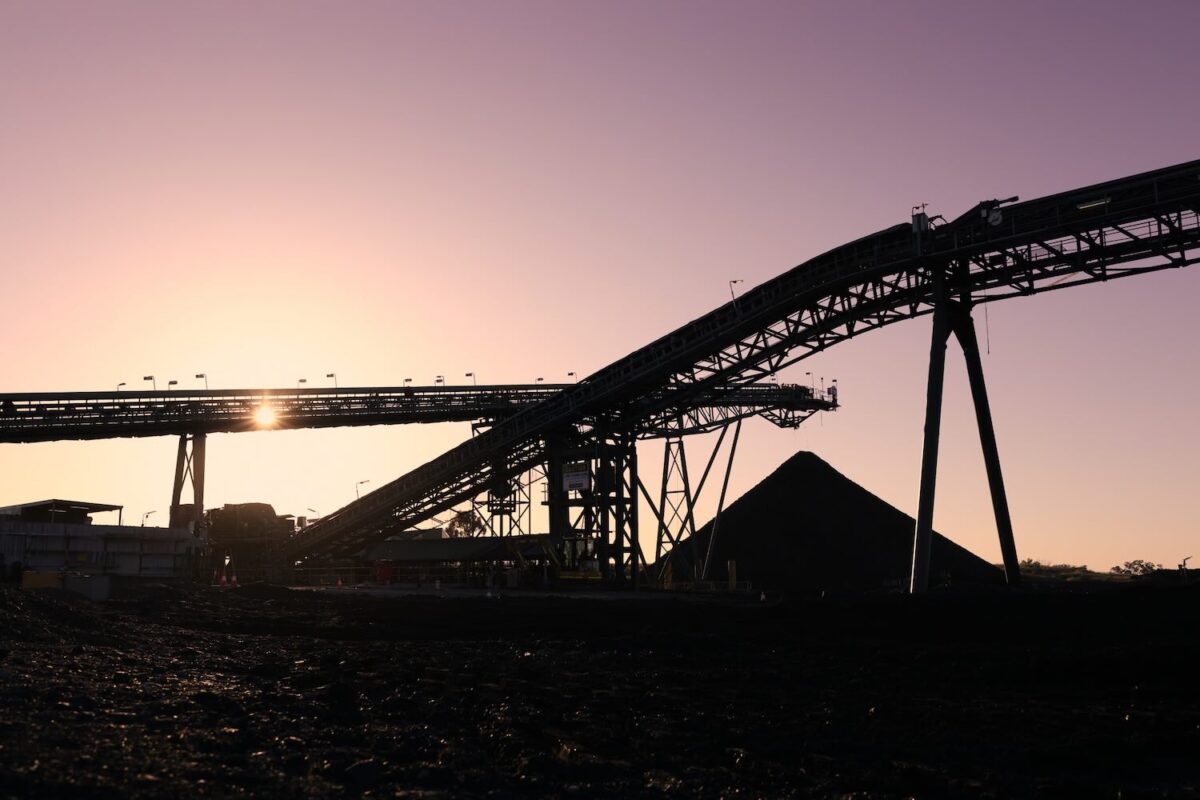
And what about coal mines?
Coal mining saw an even steeper 4.8% annual drop in fugitive emissions. But this nation-leading decline was driven by “reduced underground production,” likely reflecting unplanned closures at Grosvenor and Moranbah North. Both mines closed due to unsafe underground environments, but Moranbah North has resumed production, and Grosvenor is planning to re-start in 2027.
As mines such as these resume full production, so too will emissions, putting millions of tonnes of emissions back on the inventory’s menu.
That is, unless we see material investments and innovations in onsite mitigation. After two years of the reformed Safeguard Mechanism, we’re yet to see the onsite capital investments needed to do so.
We’re also yet to see a clear commitment to limit future mine expansions on climate grounds, leaving DCCEW modellers to sweat it out over production cycles rather than structural decarbonisation.
Compounding the uncertainty, fugitive emissions recorded a 0.7 Mt upward “revision” between the June and September updates. This likely reflects the impacts of shifting measurement regulations for open-cut coal mines across Queensland, but it’s yet another reminder of the uncertainty embedded in this sector.
Where does this leave us?
Well, if your goal remains focused on hitting the 2030 and 2035 targets, you’re probably in a tight spot. Following their COVID-linked fall in 2020, greenhouse gas emissions haven’t really budged since 2021. After a few years of recording annual emissions reductions under 1%, this last report represents a relative step change.
However, this slight acceleration now needs to ramp up rather quickly, and maintain that pace over the next decade. It will also need to embed lasting sectoral mitigation, rather than rely on the ups and downs of seasonal and production variables.
Finally, and perhaps most concerningly, it will have to tackle rising industrial emissions and data centre use. Both sectors look likely to become critical elements of a “Future made in Australia”, but their expansion risks trading one policy success for another.
Add these challenges to what looks like a maxxed out land sector sequestration, variable agricultural emissions, and stubbornly high transport emissions, and the scale of the challenges ahead come into clearer view.