As mentioned in a recent episode our weekly Energy Insiders podcast, Renew Economy is fascinated by the energy transition occurring in Western Australia’s main grid, mainly because of its huge solar and wind potential, its rapid additions of massive battery storage facilities, and because it is the world’s biggest isolated grid.
W.A. has no links to any other grid or geographies, which makes it unique in the world for its size. It has morphed from a renewable laggard – where a former energy minister once vowed never to open another solar farm, having opened the country’s first – to a region which is now looking at a step change in response to surging green energy demand.
Not everything is perfect, or even going to plan. The state plans to close the last of its coal fired generators by the end of the decade, and there is some doubt about whether it will be able to do that.
And last year, it made significant changes to the operations of its wholesale electricity markets, and its first 12 month review of its new “real-time” market offers some interesting insights.
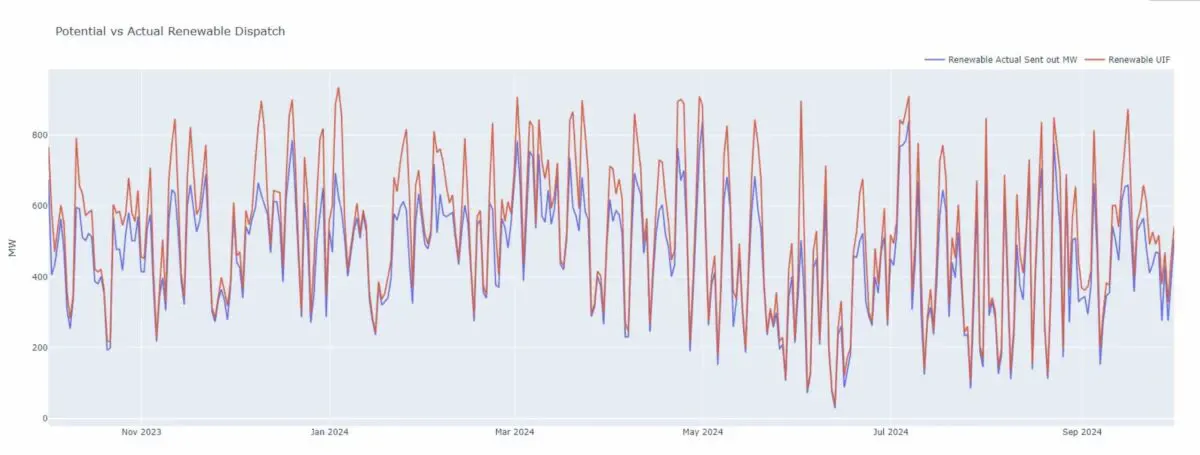
The first is the growing number of incidents where the South-West Interconnected System, the grid based around Perth and the more populous south-west of the state, has reached 100 per cent potential renewables, meaning that enough wind and solar could have been produced to cover all demand at those intervals.
States like South Australia reach 100 per cent renewables on an almost daily basis, but are able to either export or store surplus production. There is no such luxury for an isolated grid such as W.A.’s, and while Australia’s main grid – as a whole – has reached 100 per cent potential renewables on a couple of occasions, it is interesting how often it is occurring in W.A.
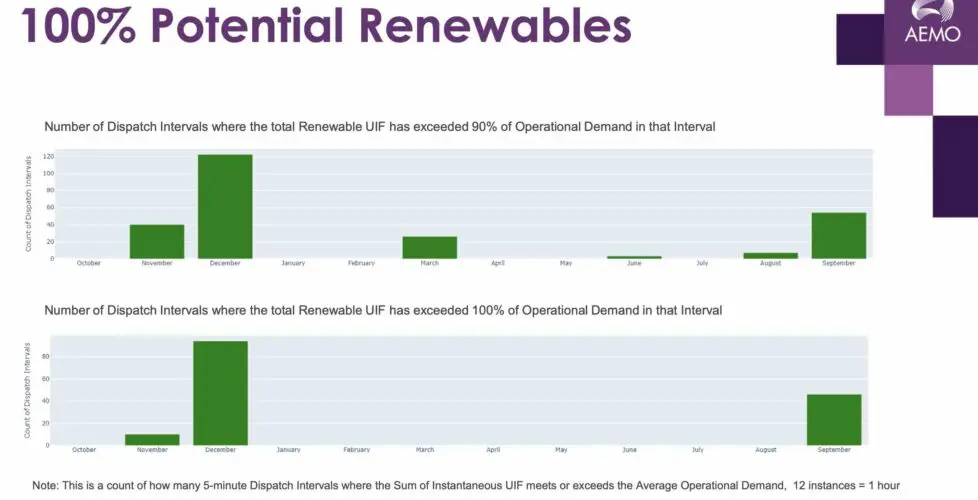
The actual highest penetration in this period was 80.1 per cent renewables in September, which is significantly higher than the 73 per cent recorded for wind and solar penetration on the NEM.
Most of the curtailment comes as a result of economic reasons, because prices fall below zero, but there are also enforced network constraints and the market operator likes to keep spinning assets in reserve to provide essential system services.
This graph below highlights another visual of the difference between potential and actual renewable dispatch.
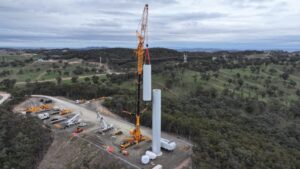
One of the big challenges of managing the W.A. grid has been the rapid growth of rooftop solar, which is now the dominant force in the middle of the day, so much so that W.A. has commissioned a whole series of some of the country’s biggest batteries to be built to soak up the excess solar and flatten the so-called solar duck curve.
That, as we have reported recently, is already having an impact with the first big battery at Kwinana effectively putting a floor on the plunging minimum operating demand levels that were causing concern at AEMO.
That battery – sized at just 100 MW and 200 MWh – is already having an outsized influence on the market, setting the price some 16 per cent of the time.
That will change rapidly as more batteries are commissioned, including the second 200 MW, 800 MWh stage of the Kwinana batteries, and the two massive 2 GWh (and bigger) batteries being built at Collie, near the sites of the ageing coal fired generators.
In September, the output of battery storage reached a new peak of 300 MW as the first 200 MW (800 MWh) stage of Neoen’s Collie battery worked through its commissioning process and dispatched at full capacity. The battery will be the biggest in the country at 560 MW and 2,240 MWh when complete late next year.
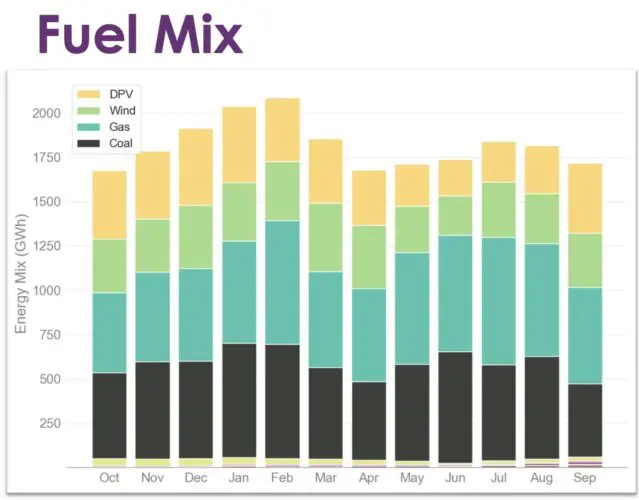
Overall, the share of renewables has grown by three per cent to 36 per cent over the last 12 months, with the biggest contribution from distributed PV (mostly rooftop solar), with 18 per cent and 17 per cent wind. Wind and solar have now overtaken gas (32 per cent) and coal (30 per cent) as the biggest contributors to generation.
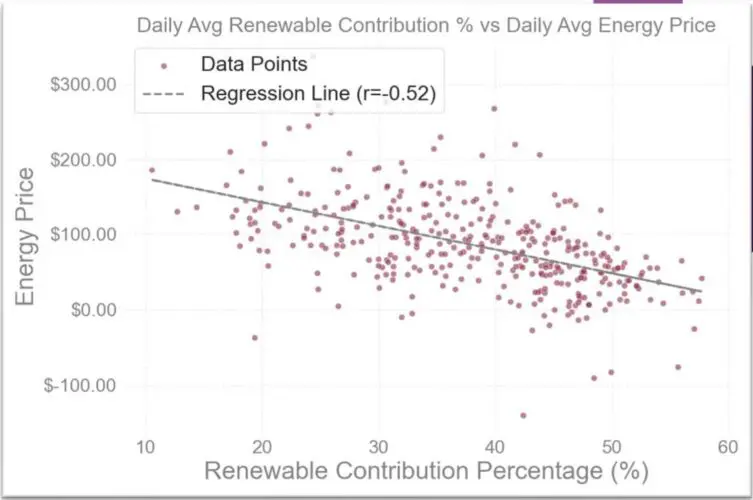
AEMO says there is a clear correlation between more renewables and lower prices.
“(The) correlations are clear between renewable contribution and prices with the increasing renewable contribution impacting the frequency of negatively price intervals,” it notes. In fact, one quarter of price intervals are negative.
Real-Time energy prices remained relatively steady for most of the year at around $82/MWh, despite record high demands in January and February which drove up prices. But they dropped markedly to $55/MWh in September, driven by mild conditions and record low demands.
The flip side of this is the increase in system security costs, despite a ministerial intervention that capped prices. It is expected that the introduction of more battery storage and more capacity to deal with FCESS needs will help reduce this, although the market is being watched.