One cent a megawatt hour. That was the average price of wholesale power for most of the daytime hours in the state of Victoria in August and September.
Record amounts of renewable energy generation on Australia’s main grid, and an abundance of rooftop solar, sent the average spot electricity price in Victoria down to around zero for six-hours of each day in August and September, a new report has revealed.
The latest quarterly data from the Australian Energy Market Operator details a three-month period from July 01 to September 30 that started with volatile high prices, but ended with record levels of negative prices, a situation that arises when supply outstrips demand.
AEMO says that across the quarter, 16% of NEM trading intervals were zero or negative, more than double the previous record of 7% in Q4 2020 – a situation it puts down to increased renewables supply, a mild August and Covid-19 restrictions reducing demand.
In Victoria, where households and business struggled through another extended period of lockdown measures, average spot prices between 10am and 3:30pm fell from $30/MWh in 2020 to just $0.01/MWh during August and September.
This follows South Australia’s achievement of average daytime prices below zero consistently between 10am and 3:30pm (AEST) during the March 2021 quarter, the first time in the NEM’s history.
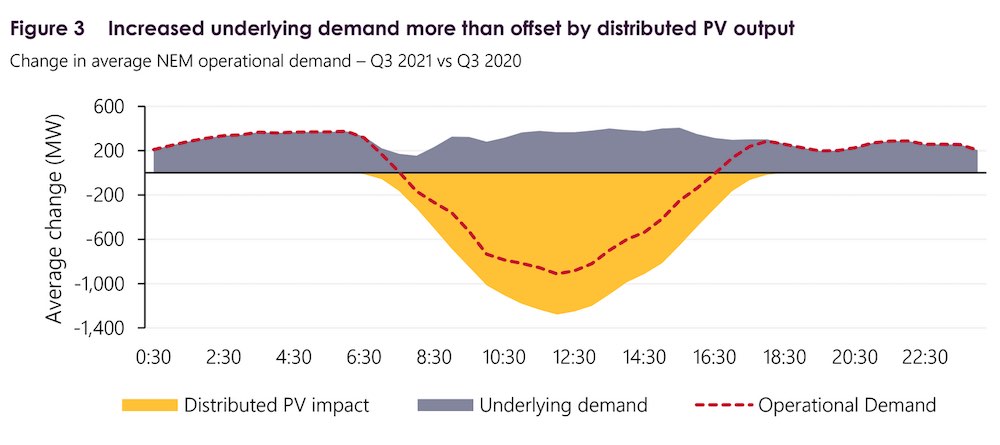
“The continued growth in distributed PV pushed minimum operational demand levels to record lows,” said AEMO chief markets officer, Violette Mouchaileh, in a statement on Friday.
“In New South Wales, minimum demand from the grid fell to 4,872MW, the lowest level since Q1 2000, while South Australia’s minimum demand record fell by 21% to 236 MW.”
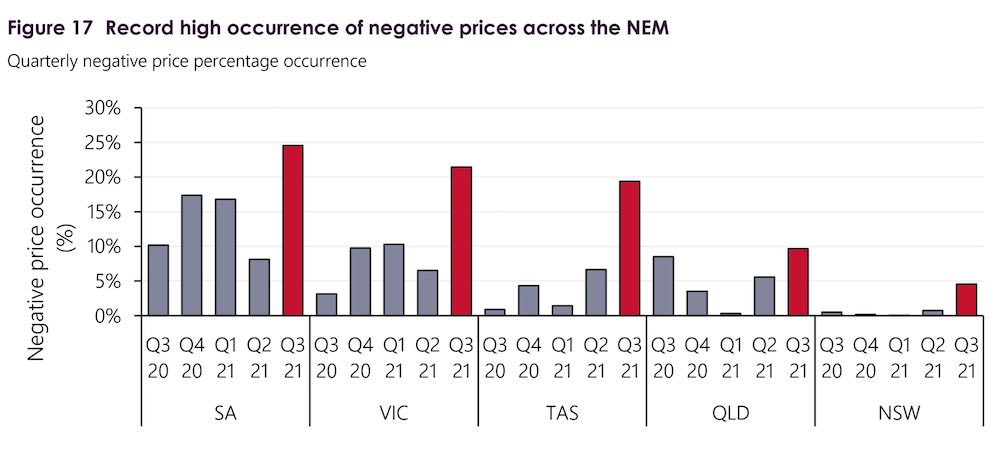
The AEMO report notes that the occurrence of negative spot prices over the quarter was up across the entire National Electricity Market, with records set in all regions including New South Wales where negative prices have previously proven rare (see chart below).
The increased occurrence of negative prices in NSW also led to a mainland NEM record, AEMO said, with spot prices going negative at the same time across all four regions of the grid 3.9% of the time, surpassing the previous high of 0.7% in Q2 2021.
The largest increase increase in negative price intervals was in the NEM’s southern regions, however, with South Australian spot prices negative 25% of the time, followed by Victoria (21%) and Tasmania (19%).
The occurrence of negative spot prices was also up in Queensland and New South Wales, but at much lower levels of 10% and 5%, respectively.
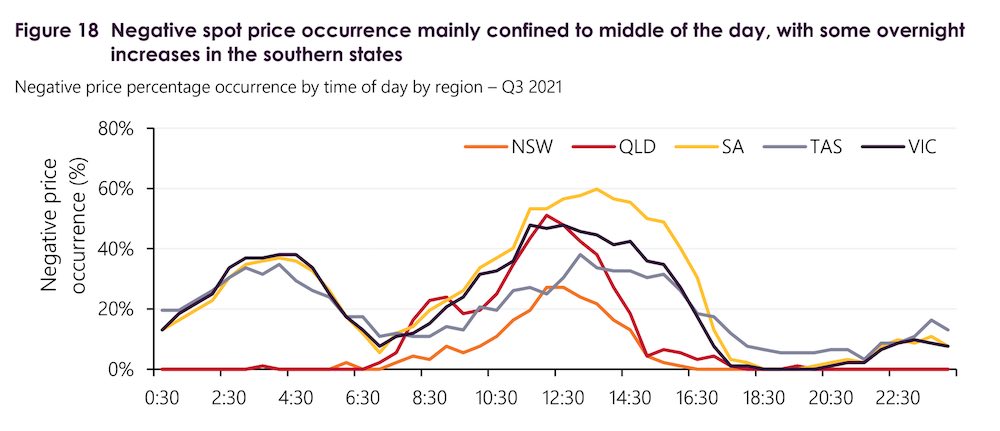
In addition to low midday demand thanks to the contributions from millions of rooftop solar generators, AEMO said wind power at night had also played a role in the increased incidence of negative pricing in Victoria and South Australia.
The report notes a marked increase in periods of very high renewables output in both of the southern NEM states, particularly from wind, due to a ramp-up of new capacity and favourable conditions.
“A combination of high wind output and low overnight and midday demand contributed to increased negative price occurrence during those periods (Figure 18),” the report says.
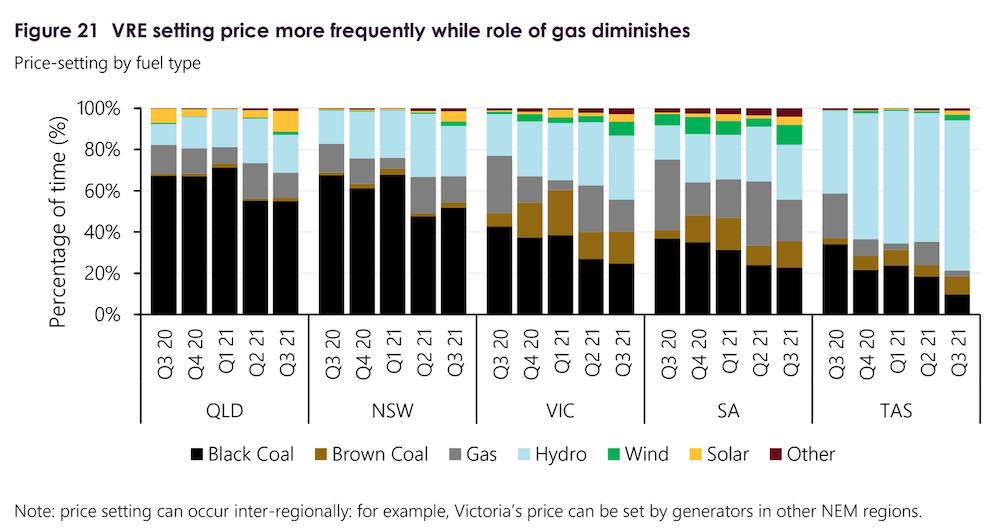
As for the impact of the negative prices on the market, the biggest loser from the trend appears to be the gas power generators, who felt the squeeze between new renewables and old coal.
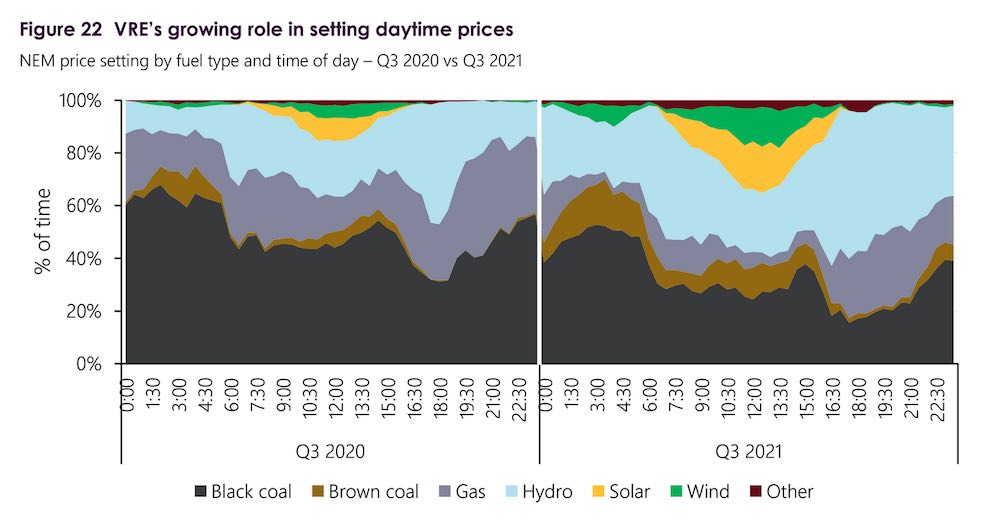
“Price-setting trends, shown in Figure 21, reflected a decreased role for gas, down from setting prices 20% of the time in Q2 to 13% in Q3 2021, with an increase in price setting by VRE [Variable Renewable Energy] from 3% in Q2 to 9% this quarter,” the report said.
“Black coal set the price slightly more often in the northern states but less so in the southern regions, indicating a greater proportion of periods where prices separated between northern and southern regions.”
For renewables, meanwhile, AEMO found that high levels of negative spot prices and the deployment of participant automated bidding software had led to a significant increase in price responsiveness from wind and solar farms.
“With increased frequency of negative prices the number of rebids by NEM wind and solar farms this quarter was four and a half times higher than Q3 2020 (Figure 19), as participants raised their offer prices to ensure they were not dispatched during negative prices,” the report said.
In NSW alone, AEMO estimates that around 45% of semi-scheduled VRE capacity has automated bidding capability, as demonstrated by the region’s 11-fold increase in VRE rebids compared to Q3 2020.


