“The tumult and the shouting dies;
The Captains and the Kings depart:
Still stands Thine ancient sacrifice,
An humble and a contrite heart”
Rudyard Kipling 1897
The splitting of the federal government’s energy and environment policies marks the end of the best chance for bipartisan approach to climate change.
As weak as the ambition in the National Energy Guarantee was, I would like to credit former environment and energy minister Josh Frydenberg for having given it is his best shot and coming up with a policy that might have been a useful stepping stone. We, the public, will never know. He comes away from the process with credit.
The appointment of Angus Taylor as energy minister is a cause for some despair for anyone looking for bipartisanship. There will likely be no meaningful federal government climate policy, no attempt to do anything towards our legally binding, but unenforceable COP 21 obligations.
Taylor brings far too much negative history to the portfolio to be ever seen as anything other than a roadblock; not even a speed-hump, but a straight-out roadblock.
Politically, the federal government has opened up an obvious line of attack to the opposition. What is the policy? It’s not credible for anyone other than the lowest of the low political parties to have an international obligation like COP 21 and not have some policy to meet it.
It’s dishonourable and has reputational consequences. If the government wishes to withdraw from COP 21 it can say so, and we will see how the electorate reacts.
For the utility industry a preliminary summary of issues is:
- 1. New coal-fired power: There is insufficient time, in my opinion, in front of a federal election to organise a federally funded new coal-fired power station.
- However, the government could take such a policy to an election. Major commitments of this kind generally take at least 12 months to organise, never mind any legislation.
- 2. Small solar scheme [SREC]: The ACCC advocates for ending this, probably not even having read the Integrated System Plan [ ISP] in which is noted the $4 billion net benefit to consumers of a more highly distributed future. Rod Sims might do better to consider how he is allowing CKI to take such a strong stake in the gas infrastructure business.
- New wind and solar-based companies provide the best competition to the established gentailers via the corporate PPA model. How about understanding that, Mr Sims, and suggesting some policies to help that process along?
- 3. Electricity prices outlook:
a) Broadly speaking, futures prices indicate about a 25 per cent decline in wholesale prices between Fy19 and FY22 to a level of say A$65 MWh. That is well below the level at which new combined cycle/reciprocating engine gas plant would be profitable at $9 GJ gas, and is below the required price for a new NSW black coal plant. Some wind and PV plants would still be profitable, but only with PPAs and it’s the price available to these plants that matters, not the average price.
For instance, wind in South Australia doesn’t get the average South Australian price, etc, and – as discussed below – AEMO forecasts minimum demand to move to the middle of the day over the next year or two.
b) On the assumption the federal government can achieve nothing that meaningful in the eight months or so prior to going into caretaker mode, the outlook is for coal-fuelled generation profitability to be squeezed. There is no short-term relief in sight for high coal prices. These are driven by demand in China and, to a lesser extent, other Asian countries. And in general new coal supply is difficult to finance and its social license is naturally and appropriately shrinking.
c) Therefore the emerging view is for price volatility. The new renewable supply with its zero marginal cost will be dispatched. It will force gas out of the system first, particularly as there now no carbon constraint at all but it will also reduce the available revenue for coal generation.
d) This will most impact coal fired stations that are either more exposed to spot coal prices or have owners with constrained balance sheets. In our view Vales Point B is the one to keep an eye on. Perhaps the most likely, as opposed to desirable, outcome is for its ownership to move to someone with a better balance sheet. At a minimum we have seen before that lower profitability causes corporate action, mothballing of units, etc.
e) This moves prices up and creates short term issues because there are only seven coal-fuelled generators in Vic/NSW/Tas/Sth Aust once Liddell closes. Economically, shutting any one of them is a major change to supply. Nothing gradual about it.
AEMO’s 2018 statement of opportunities – a treasure trove for the enthusiast
Like climate change, electricity supply, demand and price obey the laws of science and economics and not those of ideology. Policies matter, but only to the extent that they change behaviour.
In this light, it’s fascinating to see the latest insights from AEMO’s latest Electricity Statement of Opportunities (ESOO). Your analyst has been looking at this annual document since about 2006 and it’s gone from been laughably off the pace to something that can be taken very seriously and provides insights each year.
This year, I think for the first time, AEMO has broken out its estimate of electricity consumption by the coal mining industry.
The figure below is estimated from the AEMO charts but I have broken out my estimate of consumption from the aluminium industry from the AEMO provided manufacturing consumption.
It’s intriguing but probably pointless to speculate why AEMO chose to break coal out.

Also of interest :
- Cooling load is 4 per cent of annual consumption but can be 30-40 per cent of total maximum demand on a hot day, and global warming is likely to increase this by another 160MW over the next 10 years.
- Maximum demand is occurring latter in the day in most regions;
- Minimum demand is expected to move from overnight, very early morning – as has been the case for many, many years – to midday as early as next year, thanks to rooftop PV.
- AEMO’S estimates of new generation
AEMO’s change in generation by state is:

Figure 2 New capacity per AEMO. Source: AEMO
The totals are influenced by the Liddell withdrawal, which is credited at 1800MW notwithstanding its actual output rarely, if ever, gets over 1000MW these days.
ITK has a much stronger NSW number than AEMO for new supply, otherwise surprisingly much in agreement.

Looking at NSW, we still include 460MW of wind from Sapphire and Silverton, as these are still energising. So our lists are essentially in agreement. On Solar, AEMO has Coleambally and Beryl whereas ITK also includes Sunraysia, Limondale and Hilston.
On gas we also include the 250MW NSW gas plant of AGL, not yet in AEMO’s list.
It remains quite a piece of work to keep track of the new PV farms as sometimes their name changes or ownership.
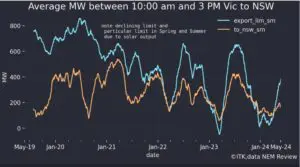
Thankfully, using NEM Review we can look at the overall picture:

There’s still a long, long way to get to 26 per cent emission reduction.
The market action:
Consumption was flat, spot prices up, futures prices flat, gas prices are above last year and perhaps unsurprisingly sit right around the lower level of import parity. Gas prices will probably go up as international competition for Australian gas remains strong, as it does for coal.


Internationally, US 10 year bond rates once again retreated from the 3 per cent level, oil prices jumped 10 per cent, are flat on last year but still are high enough to keep pressure on domestic coal prices as indeed does thermal coal.

Share prices
The big news of the week was Andy Vesey’s departure from AGL. This leaves AGL to be run by Brett Redman, previously CFO. AGL and ORG both now have ex-CFO’s running their companies.
We look forward to strong financial management as a result, but I’m not convinced that a good, even excellent, CFO is always the best person to develop and execute strategy.


Volumes

Base Laod Futures, $MWH


Figure 12 Baseload futures Financial year average. Source: ASX
REC Prices

Gas Prices


David Leitch is principal of ITK. He was formerly a Utility Analyst for leading investment banks over the past 30 years. The views expressed are his own. Please note our new section, Energy Markets, which will include analysis from Leitch on the energy markets and broader energy issues. And also note our live generation widget, and the APVI solar contribution.


