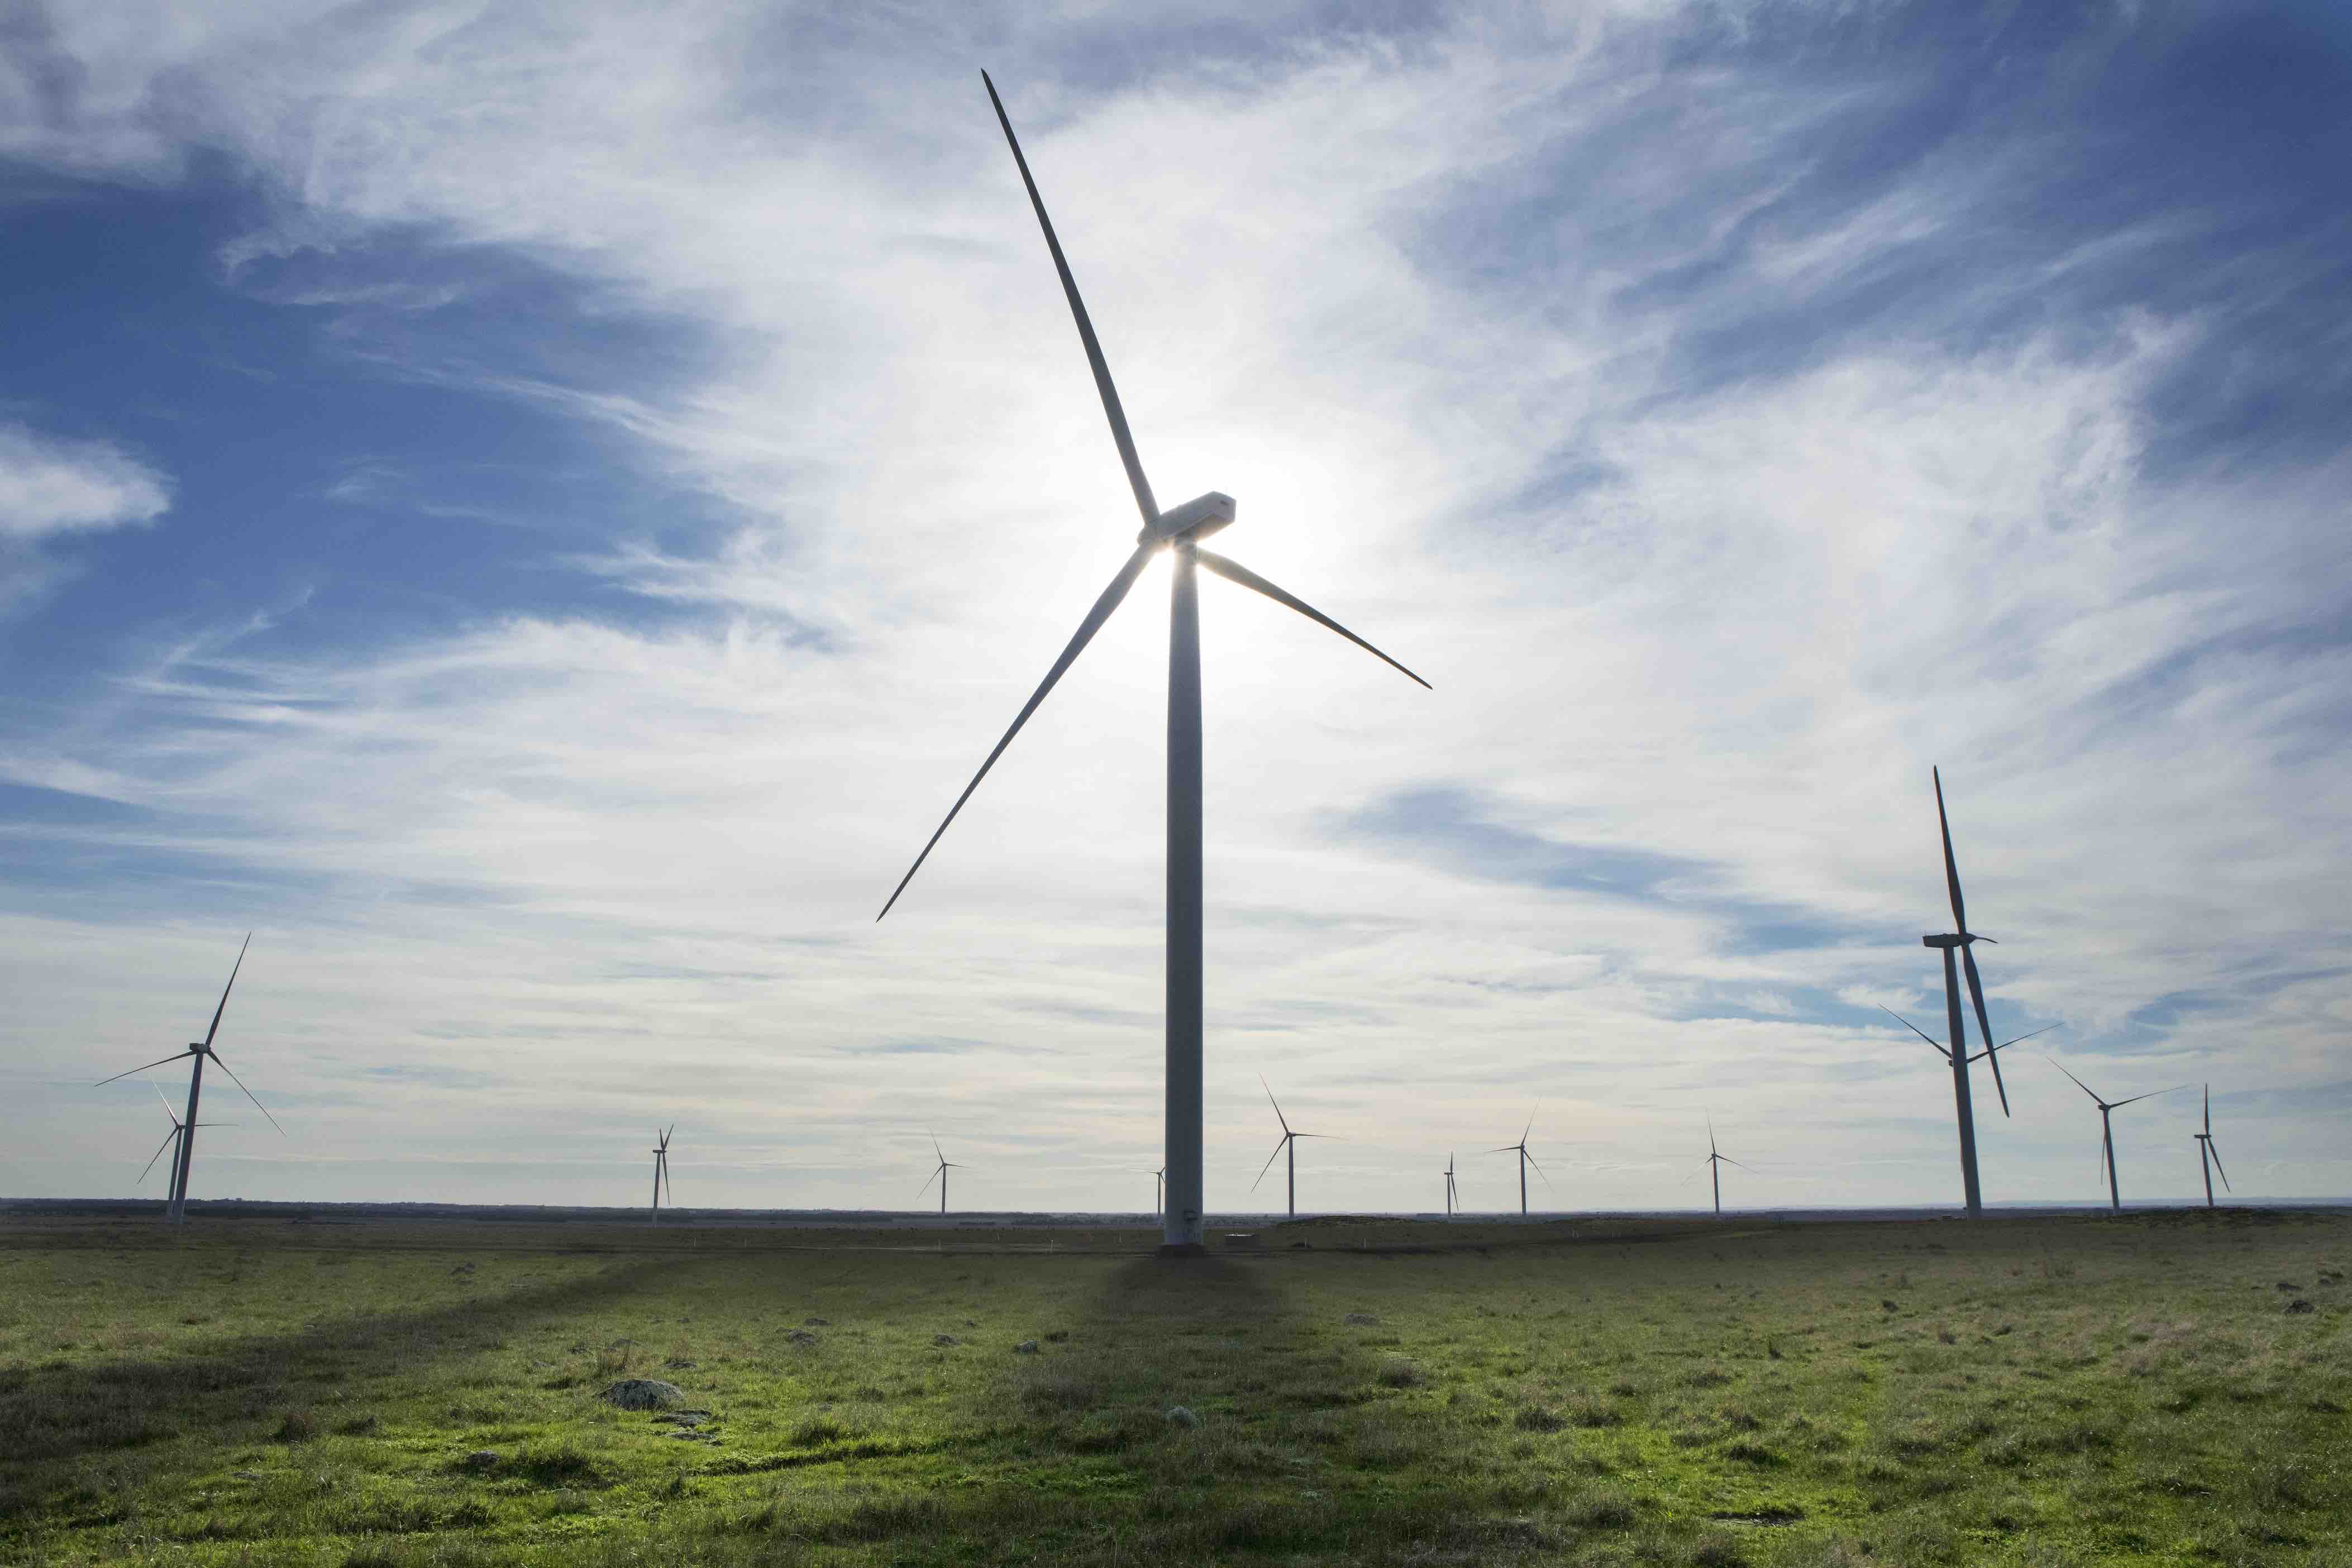
Australia experienced a significant jump in output from hydro power, and wind and solar farms in the second quarter of 2018, mostly at the expense of gas generation and some black coal output.
The latest Quarterly Energy Dynamics report from the Australian Energy Market Operator shows that in the second quarter the average output of hydro increased by 663MW, wind by 546MW (thanks to new generation and better wind conditions), and solar by 157MW (new generation).
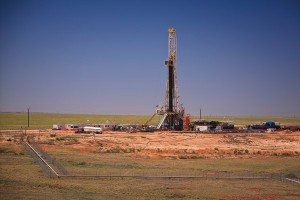
This was offset by a big fall in the average output of gas generation (down 697MW) and from black coal generation (down 53MW). Both of these technologies reported major outages – planned and unplanned – and came despite an overall rise in demand mostly due to the record high temperatures in April.
Indeed, as the next set of graphs illustrate, over the last year the average output of large-scale wind and solar generation has jumped 63 per cent from 954MW to 1,551MW, and made up 7 per cent of the supply mix over the quarter, compared to 4 per cent a year earlier.
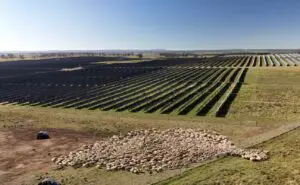
Wind generation was up an average of 546MW (or 61 per cent), mostly from an increase in output from existing wind farms after the poor results in Q2 last year, while large-scale solar generation increased by 51MW (or 82 per cent) as a result of new capacity.
Many of the new wind and solar farms have only just been connected, or are not yet at full capacity, so their full benefit is yet to be felt.
The average Q2 output from rooftop PV increased by 19 per cent from 562MW to 669MW, with NSW leading the way, in terms of percentage increase, followed by Queensland, Tasmania, Victoria and South Australia.
The daily maximum average generation of rooftop solar PV also increased by 19 per cent, from 2,216MW to 2,637MW, reflecting the big increase in rooftop solar capacity over the last 12 months.
Gas output was down, thanks to the closure of Tamar Valley in Tasmania, and outages at Mortlake and Pelican Point in South Australia, while coal was down slightly due to extended outages at Bayswater and Eraring, offset by increased output at Gladstone and Milmerran in Queensland.
The big increase in renewables, and the big fall in gas, had two happy outcomes.
The first was the continuing fall in emissions, which fell to their lowest levels on record in fiscal 2017/18, in terms of both absolute emissions and emissions intensity (Figure 12), thanks to the closure of Hazelwood and the increase in renewables, AEMO says.
Given the fall in emissions (purple bars), and the expected falls in the next two years as a result of the new projects being built for the renewable energy target, it beggars belief that the Energy Security Board is modelling only a 2 per cent fall in emissions from 2020 onwards thanks to the National Energy Guarantee.
In effect, it highlights the fact that the policy is designed to deliberately strangle renewable energy investment, for the sole reason that the Coalition government is afraid of announcing a higher emissions reduction target, even though its current target will be all but met by 2020.
The other happy outcome of the increase in renewables over the last quarter was the fall in wholesale prices – both on the spot market and the futures market.
The Coalition government on Tuesday tried to credit the proposed NEG for this reduction, particularly in futures prices, even though it had barely made it through the party room two hours earlier.
The AEMO report makes it clear the falling prices are the result of increased renewable energy.
Price falls were most marked in Queensland, where the government has instructed its generators to bid low, and in South Australia (down $13-20/MWh) and Tasmania.
- AEMO credited the price falls in the southern states to increased availability of lower-priced hydro capacity and increased wind generation.
- The only significant increase came in coal-dependent NSW, where prices rose $12/MWh because two of its biggest coal generators were off-line for repairs for much of the quarter.
As for futures prices, particularly the 2020 settlement where prices fell by an average $10/MWh, AEMO said this was caused by “increased market sentiment that a significant amount of new renewable capacity will enter the market by 2020.”
This is also reflected in the fall in large-scale generation certificate forward prices, which have fallen to one-third of the spot price.
- On the other hand, South Australia recorded its lowest Q2 operational demand on April 29 at 1230hrs of 793 MW, which was 51MW (-6%) lower than the previous Q2 record.
- AEMO said this continues a trend of reduced demand in the middle of the day, driven by increased uptake of rooftop PV, which has taken demand as low as 587MW in spring.

