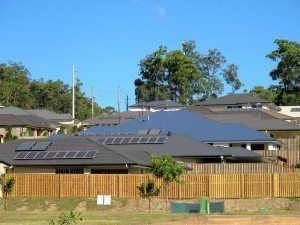
Solar made up over a half of the added power plant capacity during the first quarter of 2016. With over 800 MW (AC) coming from distributed solar, this year is shaping up to be another banner year for renewable energy.
Distributed Solar and Wind Tied for Added Power Plant Capacity
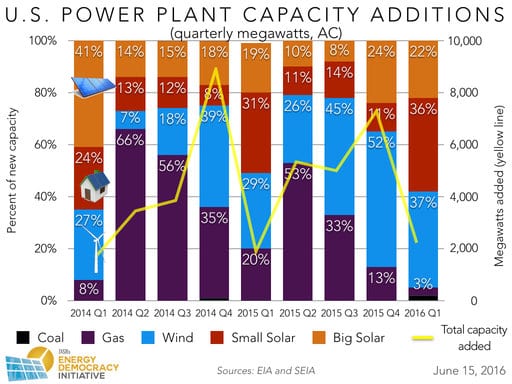
For the sixth quarter since the beginning of 2014, renewable energy power plant capacity made up two-thirds or more of new added power plant capacity. Wind projects and distributed solar made up over a third of the added capacity during the first quarter of 2016. Below is data since 2003.

In the beginning of a new year, solar seems to be starting another banner year, thanks in large part to continued renewable energy tax credits and despite the continued fight between solar and electric utilities.

While the fight against solar energy is strong in some places (such as Arizona or Nevada), communities (as well as rural electric cooperatives) around the country are developing their own community-owned renewable energyresources, and even seizing upon new technologies such as microgrids to take control of their energy future.
Source: ILSR. Reproduced with permission.