Renewable Energy Market Report – October 2016
Large-scale Generation Certificate (LGCs)

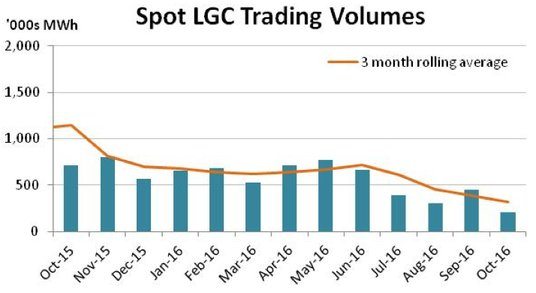
With the spot LGC market having already pushed so high, some of the heat came out of the market in October, with price stability and considerably lower trade volumes reigning. Yet October was significant for another reason as it yielded the first reported trades in the Cal 19 vintage
With some fairly seismic gains under its belt across the new financial year, the spot LGC market began October in the low $89s. That it had already reached such a level was impressive and likely beyond the expectations of most predictions made earlier this year. With less than $4 till the market reached its theoretical cap (the tax effective penalty rate) and over 15 months to carry the LGCs till the 2017 compliance date (14th Feb 2018), it was perhaps no surprise then that the LGC locomotive ran out of steam.

Though the initial trend was mildly positive (the spot reaching a high of $89.50 a week in), it wasn’t sustained with the market softening back to $89.00 before settling around the $89.25 mark into the middle of the month. The spot did reach the $89.50 high once more toward the end of the month, before again encountering resistance and ultimately concluding October at $89.40, a $0.25 improvement on September’s close.
Whilst the sum of the activity nonetheless saw the spot close higher, perhaps the most telling statistic was the monthly spot trade volume which, at 210k, was the lowest since August 2014, well before the withering rally began.

October did however prove an interesting time in the forward market, with action across the curve and the first reported trades in Cal 19 taking place. The Cal 16 vintage managed to preserve a higher rate of escalation (2.5%+) compared to the other vintages for most of the month, though it eventually flattened late in the piece to around the 2% mark. The Cal 17s were also active across October at roughly 2% above spot. From there the curve remained backwardated with the Cal 18s trading $0.50-$1.00 below the spot in a reflection of both the extremely high pricing at present and the uncertainty that an extra year brings.
The highlight however was unquestionably a series of trades in the Cal 19 vintage, the first of their kind, reported at $81.00. The discount of over $8 below the spot was the subject of discussion in the market with differing views as to its appropriateness.
On the one hand there are those who believe it highly unlikely there will be sufficient project commitments to meet the Cal 19 target and thus the market (in their view) should remain at penalty pricing levels for that vintage.
On the other hand are the project rollout optimists and the regulatory pessimists who believe that the status quo will change, either as a result of a mass rollout of projects or an intervention from Government in the face of several years of penalty pricing impacting on end use customers.
The choice for buyers now in Cal 19 is whether to bet against either of those two scenarios; a prospect that, given the recent history, many feel quiet uneasy about. From the seller’s perspective it is a question of locking in what is unquestionably a fantastic price on the basis of project economics, but one that should everything remain the same, could very well mean giving up an otherwise extremely welcome $10+.
Small-scale Technology Certificates (STCs)

The eyebrow raising run of forward STC activity continued across October with late 2017 and 2018 the main focus. Meanwhile in the shorter term the passage of Q3 compliance ensured the Clearing House will remain in deficit for at least 3 months and possibly longer.
For a market that has almost ceased to be, the forward STC activity in recent months has piqued the attention of many participants. In October it was activity in late 2017 and across 2018 that saw the focus with prices improving across the month. Initially it was trades in Jul18 and Oct18 at $39.50 that got the month going, both representing a $0.20 improvement on the last previous trade levels. This was then followed by another chunk for Aug18 back at $39.35. Later in the month a parcel of Feb18s was agreed at $39.70 along with several late 2017 parcels at the same level.
The run of forward activity reflects concerns among some segments of the market that the scheme may return to the boil next year, potentially buoyed by the roll off of many premium feed-in tariff customers. It is also a reflection of an appetite for certainty at what are (particularly for 2017 and early 2018) fairly modest discounts to the $40 Clearing House price.

STC submission numbers were mixed across October with some initially lower figures followed by a spike late in the month. The submission profile appears to be a reflection of an Australia Standards issue which saw a temporary impact on many inverters which had not received certification at the time of the change. Most of the major inverter companies managed to remedy the situation shortly afterwards but not in time to have avoided some consternation among STC agents.
Marco Stella is Senior Broker, Environmental Markets at TFS Green Australia. The TFS Green Australia team provides project and transactional environmental market brokerage and data services across all domestic and international renewable energy, energy efficiency and carbon markets.


