What’s interesting this week, All change as US debt markets move
- To us what’s interesting is: Rising US 10 year bond rates. Incredibly, the US 10 year rate @ 2.84% is now fractionally above Australia 2.81%. This must have happened before, but I can’t ever remember it. The US deficit is set to increase US$1 trillion (‘000 bn) this year and top US$20 trillion in total. It’s not the place of this note to overly dwell on finance but it will impact renewable energy WACC (weighted cost of capital). 90 day money is up 100 basis points (bps) and 5 year money up 50 bps compared to a year ago. It’s not just the shift in the level but also the shift in the slope. An upward sloping yield curve is broadly expansionary and downward sloping recession inducing.

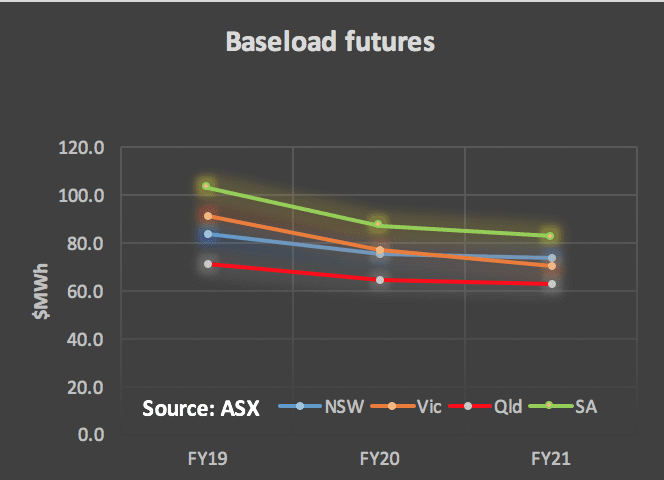
- State elections may mean changes in electricity policy. Betting odds are against the ALP in both South Australia and Victoria. Electricity prices as represented by base load futures are higher in South Australia and Victoria than they are in NSW and QLD and this may be used as an election issue. Prices are higher in South Australia and Victoria because the thermal supply/demand balance is tighter than in previous years and because the QLD Govt. is holding generation prices down and this feeds through to NSW. We are already seeing the Liberal Party in Tasmania stating it will withdraw from the NEM if it wins that election. This is surely a retrograde step and a very short term one. In the past Tasmania has received considerable benefit from lower prices in Victoria and there surely must be a penalty if Tasmania wants to leave the system one year and rejoin the next.
- Increasingly, we think the debate is shifting to how to incentivize dispatchable renewable power, and how much of that is going to be needed. The clear task is to replace the ageing coal fleet and to do this a start needs to be made now. Concentrating solar, batteries in front and particularly behind the meter, pumped hydro and a little bit of gas all need to be encouraged. To get the coal generators out of the system by 2030 is not hard if we make steady progress. What’s lacking in this move, outside of policy, is an authoritative study or two to work out how much dispatchable energy is required for a given level of variable renewables [VRE]
Market action – cool weather sees consumption fall back
Consumption in the week to February 3 fell 8% across the NEM with a 13% fall in NSW and 8% in QLD. Victorian demand rose. Consumption is driven down by cooler weather for the week and trend wise by the ongoing rise in behind the meter PV and energy efficiency. Demand for gas is lower when the weather is mild and gas prices fell fractionally in NSW but were up in QLD and Sth. Aust.
Futures prices for FY19 rose a couple of per cent almost as if traders had gone back to work and decided to make a few trades.
As you can see from fig 6 (NEM consumption year by year on an annualized basis) if there is going to be any real dram this Summer from heat and blackouts it will almost certainly be over the next 2-3 weeks.

We continue to see bond yields rising, and Australian yields are rising faster than in the USA and this is helping push up the A$. So despite coal and oil prices in US$ being up 9% year on year in A$ terms its just 3%.
| Know your NEM: Commodity data for week ended 3 Feb 2018 | ||||||
| Last | 1 year | chg on | chg on | |||
| latest | week | ago | Week | year | ||
| Oil (Brent) | US$/b | 68.49 | 69.91 | 61.18 | -2.0% | 11.9% |
| Coal (thermal Newcastle) | US$/t | 104.75 | 106.95 | 96.75 | -2.1% | 8.3% |
| Oil (Brent) | A$/t | 86.25 | 86.61 | 80.56 | -0.4% | 7.1% |
| Coal (thermal Newcastle) | A$/t | 131.92 | 132.50 | 127.39 | -0.4% | 3.6% |
| USA 10 year bond | % | 2.85 | 2.61 | 2.32 | 8.8% | 22.6% |
| Australia 10 year bond | % | 2.81 | 2.79 | 2.58 | 0.5% | 8.8% |
| USD | $ | 0.79 | 0.81 | 0.76 | -1.6% | 4.6% |
| Source: Factset | ||||||
Share prices
Investors have reacted positively to Redflows communication of progress on their new factory in Malaysia and lithium shares recovered modestly from the prior weeks setback. ORG over the past 12 months has moved from the 3rd largest utility by market capitalization to the largest at $16 bn just edging out AGL at $15.4 bn. Yield based utilities continue to struggle as yields rise.
Rising interest rates mean lower prices. Regulatory allowances which compensate investors for changes in market conditions tend to lag the real world. This worked in investors’ favour when rates were falling but against them at the moment.


Volumes

Base Load Futures, $MWH


Gas Prices


RenewEconomy & SunWiz’s Large Scale Lookout subscription service is all you need to understand the market for solar farms, and for commercial & industrial PV over 100kW.
David Leitch is principal of ITK. He was formerly a Utility Analyst for leading investment banks over the past 30 years. The views expressed are his own. Please note our new section, Energy Markets, which will include analysis from Leitch on the energy markets and broader energy issues. And also note our live generation widget, and the APVI solar contribution.