The crisis continues
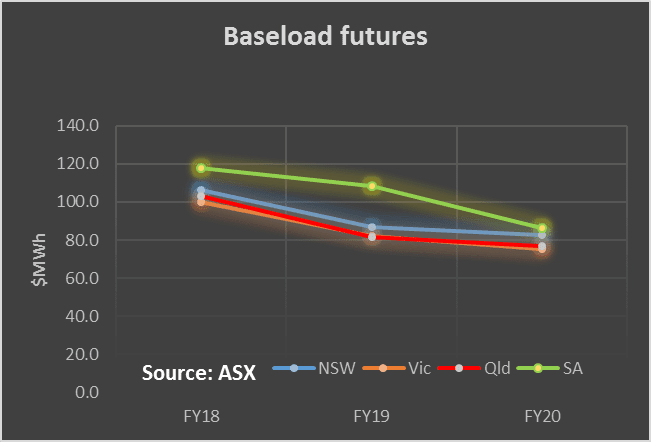
Although electricity consumption and pool prices fell sharply this week due to more moderate weather, 2018 base load futures rose another 5%.
That’s three weeks in a row prices have risen 5% and FY18 futures prices have now cracked the $100 MWh mark in all States ($99 MWh in Victoria). Prices in the out years are not so high but there is much less trading in the out years (2019 and 2020).
More renewable energy will be available in FY19 from the current buildout of easy to build, fast to construct wind and PV farms. The Federal Govt must be very grateful for that, because without it there chances of a crisis are quite high.
It should be blindingly obvious to even the most rabid supporter of coal that no new coal power stations could ever be operating within the next six years, and frankly the same goes for a gas cogen plant. Renewables, lithium storage and maintaining the old coal and gas generators are the best bets for the next two years.
What I want to hear is what the Govt plans to do about energy security over the next 18-24 months. As Portland works up from 25% to 100% of capacity and Hazelwood closes, the prospects of drama have increased. On top of that significant institutional reform and a decent “integration” study are needed.
We regard the ALPs 50% renewable as the minimum target that should be aimed for but if the ALP doesn’t back the plan up with a study showing how it will be achieved and what the costs are, it leaves itself open to the current attacks. A decent integration study shouldn’t be that hard.
Turning to the weekly action
- Volumes: for the week ended February 24 were down 9% year on year across the NEM lead by NSW, Victoria and South Australia. Cool, rainy weather was the driver. For the Calendar year to date volumes are up 3% across the NEM despite Portland Smelter operating at just 25%-33% of capacity
- Future prices: As noted above these have risen another 5% for FY18 and are double what they were 12 months ago. These futures price increases lock in price increases for consumers in the order of 20% in our view.
- Spot electricity prices: These remain 70% -80% above last year’s levels for the most part although just 33% in QLD. However, spot prices fell sharply from last week and the week was very uneventful with the highest halfhourly price in Tasmania at just $208 MWh
- RECs: Unchanged.
- Gas prices: These remain around $10 GJ again down from last week but still massively above last year. An open cycle peak generator has a fuel cost of $100 MWh at these prices. Most gas generators have contracts so the spot prices are not yet what they actually pay. High prices will somehow or other induce new supply. That’s how the market works.
- Utility share prices: .It was a poor week for utility shares. Only two shares were in positive territory for the week. ORE, our favorite lithium producer is well down over the past month as worries (not by us) surface of oversupply. Neither APA nor ORG’s results were well taken by the market despite showing indications of improvement in ORG’s case and towards the top end of guidance in APA’s case.

Share Prices

Volumes

Volumes

Base Load Futures

Gas Prices

David Leitch is principal of ITK. He was formerly a Utility Analyst for leading investment banks over the past 30 years. The views expressed are his own. Please note our new section, Energy Markets, which will include analysis from Leitch on the energy markets and broader energy issues. And also note our live generation widget, and the APVI solar contribution.


