Leaving the AEMO reports and Liddell to one side, there was little visible progress on policy development during the week.
No significant new projects were announced as having reached FID (financial closure)
Santos and Origin have made some more gas available to the domestic market, but not in a quantity that really changes the fundamentals.
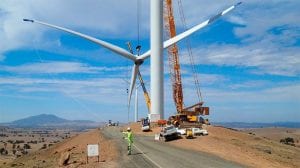
Perhaps the most interesting thing reported during the week was new retailer Flow Energy’s signing of a 10 year 50MW PPA with Ararat wind farm in Victoria
We have long seen that there is a need to develop the corporate PPA market in Australia.
The big three retailers have long made it clear that they are mainly interested in the household market. ERM, very well regarded for its IT systems, has been the goto retailer of choice at the big end of town.
ERM though has, in our view, come very late to the renewable market and, in our view, still sees it as a cost and not an opportunity.
New retailers, and intermediaries that can help large business to contract directly with producers as part of a portfolio approach via wind PPAs or direct finance of behind the grid PVs surely seems to be a market gap.
Turning to the weekly action
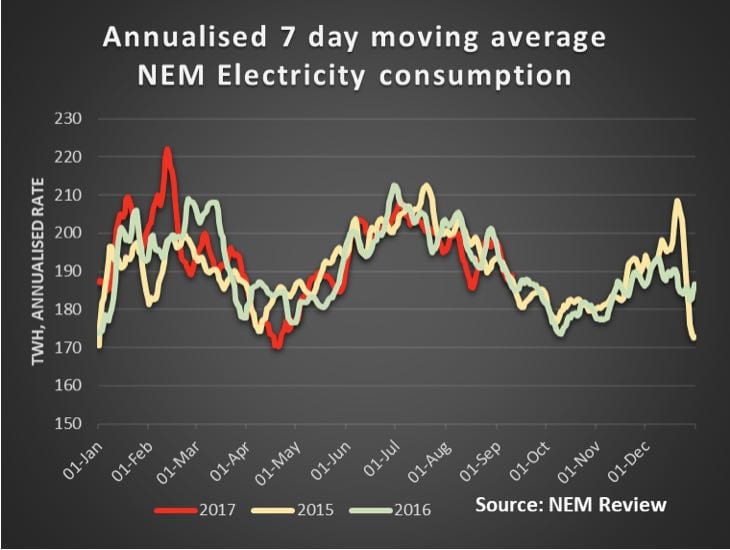
- Volumes:. Were 2% higher over the last 7 days across the NEM compared to PCP (previous corresponding period) driven by a 5% increase in VIC and 1% in NSW. Over the CYTD (calendar year to date) volumes remain flat on PCP. According to our records of capital city airport temperatures, the average has been consistently colder than last year for weeks in both Melbourne and Sydney and we think that drives up consumption a bit. Overall consumption for the year would be further ahead if Gladstone aluminium smelter hadn’t cut back production about 10%
- Future prices near term futures prices again rose 1% over the week but FY20 prices remain flat. This is actually a disincentive to investment in new supply. For instance, the FY20 QLD baseload prices is $63 MWh. That’s the downside of the Qld Govt. policy to intervene in the market. Less new investment. FY20 price of $76 MWh in NSW and $77 MWh in Victoria still seems to allow some head room for the best wind and PV farms to go ahead. However, without a CET or some policy beyond 2020 investment will slow.
- Spot electricity prices there was a lack of volatility in the spot market and despite little change in demand spot prices fell significantly on the previous week although still massively up on last year. The spot price in Vic was $28 MWh last year at this time and now its $94 MWh.
- REC. An unusual week for REC prices in that the indicators moved. 2019 was up an indicated 13% and 2020 down 4%. We still wouldn’t be factoring much in beyond 2020.
Gas prices were modestly changed on the week but are now 62% up on last year in NSW and 40% in South Australia. We are simply not yet seeing the seasonal drop off in prices.
Utility share prices. WLD was unable to sustain its early strength and dropped during the week. The best performers were ORE and AGL. The good performance by AGL indicates that the market sees that AGL will benefit one way or another from micro management by the Federal Govt.

Share Prices


Volumes

Base Load Futures, $MWH


Gas Prices


David Leitch is principal of ITK. He was formerly a Utility Analyst for leading investment banks over the past 30 years. The views expressed are his own. Please note our new section, Energy Markets, which will include analysis from Leitch on the energy markets and broader energy issues. And also note our live generation widget, and the APVI solar contribution.


