Last week we highlighted the huge wind day in South Australia on Anzac Day, when wind reached record output of 1540MW at one stage, and provided more than 100 per cent of the state’s demand for several periods during the day.
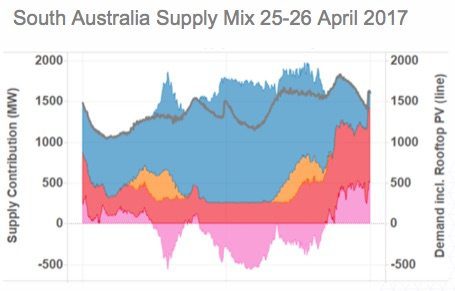
Here’s a more detailed graph of what happened, courtesy from a presentation by US battery storage giant AES made at the Australian Solar and Storage conference in Melbourne this week.
The graph, using data from WattClarity, who provide our much-watched live widget on generation in the Australian electricity market, shows the details of who provided what and when during that day.

The first thing to note is that for most of the day (Anzac Day) and the day following wind was the dominant source of electricity, although it is important to note the contribution of rooftop solar (which does not include the rooftop solar component consumed at home and not seen by the grid).
On April 26, wind provided more than the state’s demand for much of the morning hours, and during the middle of the day on April 25, with the help of rooftop solar. That is illustrated on the graph to the right, with the yellow line showing renewable’s share of demand and the blue showing prices.
Interestingly, there was only one negative price period, when the exports from the state to Victoria approached the maximum load of more than 500MW. That’s good news and explains one of the reasons why the interconnector was expanded last year.
During those upgrades, and when the interconnector was constrained or not available, power prices shot through the roof in South Australia as the remaining gas generators exercised their marketing power.
Some say that the interconnector should have been made much bigger, because when South Australia adds the Hornsdale 2 and 3 wind farm, and some of the other projects for which contracts have been signed, it may not be able to use or export all its wind energy. Hence the call for new connections to Victoria or NSW, and also as a boost to energy security.
The graph was displayed by AES because it is clear these sort of days will become more common, particularly as the near 1,000MW of new wind and solar projects currently under construction and about to start, come on line within the next 12 months.
And it also underlines the case for battery storage. AES says it is involved in several different proposals in the South Australia government tender for 100MW/100MWh of battery storage, which attracted 90 different proposals in the expression of interest stage.