Know your NEM: Share price surges, higher spot prices

Figure 4: Electricity volumes 10 day moving average

-Spot electricity prices shot up and continue to be well above PCP

– Volumes continued to be soft this week despite a return to cooler weather. NSW volumes were 5% below PCP and VIC 2%

– Futures prices continue to increase

– REC prices increased – Gas prices increased particularly in NSW

– Share prices went up, particularly that of Infigen

nem1
Figure 1: Summary table

Share prices
What a run it’s been lately for Infigen and Redflow. Infigen is conceptually comparatively simple to value as it has a bunch of operating wind farms, some development options and a known balance sheet. The value of the company including its debt can be compared with the cost of building new wind farms of equivalent size.

Of course, Infigen’s wind farms are operating today and some have very attractive PPAs. Battery storage developer Redflow is far more immature and value is essentially in the eye of the beholder. We will have a closer look in the future. We also plan to add Genex to this list when time permits. Still, it’s a great time to be a utility investor.
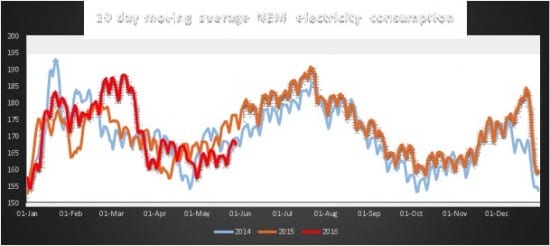
NEM 2
Figure 2 Utility share prices


Figure 3 Listed shares monthly and yearly performance (not adjusted for dividends)

Volumes
Are currently below 2015 but steady with 2014. Weather has a major influence on week to week trends.

Figure 4: Electricity volumes 10 day moving average


Base load futures by State
The most noticeable shift in the futures curve over the past six weeks is in Victoria where possibly the potential closure of Hazelwood has moved the curve up. It seems that traders are not that concerned at the moment that Portland smelter will close. Closure of Hazelwood would likely be taken as a positive for the AGL share price.

volume 5 volume 6
volume 7 volume 8

Spot prices have risen more than expected – particularly in NSW

volume 9

Figure 6: Pool prices calendar year to date averages


Spot prices continue to be 50% and more above levels of PCP despite demand being little changed. In our view, and particularly in NSW the existing suppliers, primarily AGL and ORG have bargaining power and they are using it. The spot prices this year make the ACCC’s opposition to AGL’s bid for Macquarie Generation much more reasonable.

This was yet another example where the Australian Competition Tribunal, no doubt upholding the letter of the law, ended up providing a result that at least in the short run ends up disadvantaging consumers.

That said the absolute CYTD averages in NSW and South Australia of $52 MWh are not that unreasonable, and in fact still cheaper than in China! Spot prices in the USA though have been averaging $23 MWh for the current quarter.

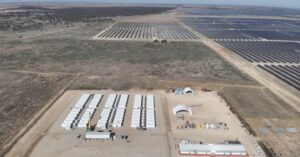
The spot price in QLD is very close to justifying new renewable generation on an unsubsidized basis. In this sense the market is working the way it is supposed to, higher prices send a signal justifying new investment, or not.

Gas prices also increasing particularly in NSW

Gas prices have been up in year on year terms for some time, but in NSW have taken a big jump up in the past week.

David Leitch is principal of ITK. He was  formerly a Utility Analyst for leading investment banks over the past 30 years. The views expressed are his own. Please note our new section, Energy Markets, which will include analysis from Leitch on the energy markets and broader energy issues. And also note our live generation widget, and the APVI solar contribution.

David Leitch is a regular contributor to Renew Economy and co-host of the weekly Energy Insiders Podcast. He is principal at ITK, specialising in analysis of electricity, gas and decarbonisation drawn from 33 years experience in stockbroking research & analysis for UBS, JPMorgan and predecessor firms.

Comments

5 responses to “Know your NEM: Share price surges, higher spot prices”

  1. Mick Avatar
    Mick

    Excuse my ignorance – but what on earth is PCP?

    (And does CYTD = Calendar Year to Date?)

    1. GregX Avatar
      GregX

      Previous Corresponding Period and yep.

      1. Jonathan Prendergast Avatar
        Jonathan Prendergast

        GX is ITK

  2. Malcolm M Avatar
    Malcolm M

    Our gas price of $7.46/GJ is more than the price of LNG landed in Japan. After allowing for unit conversions, the contract price of LNG in Japan is $5.50/GJ, and the spot price $7.60/GJ. How can the LNG plants liquify the gas and ship it to Japan for less than the spot price in Australia ? How could the LNG plants contract delivery of gas at much lower prices than Australian industrial consumers ? (For example, the Duchess rock phosphate plant has its own pipeline from the Cooper gasfield to support its ammonium plant, but is likely to close when its fixed-price gas contract finishes in a few years time because the gas companies won’t contract gas at a price competitive with other ammonia plants in the world.) Would the LNG exporters be better off selling their contracted gas to the Australian spot market rather than the Japanese spot market ?

    Can someone on “Know your NEM” please enlighten readers. Our gas market seems to behave counter-intuitively.

    Unit conversions are AUD 1.38/USD and 0.95 MBTU/GJ

    Japanese spot prices quoted are here:
    http://www.meti.go.jp/english/statistics/sho/slng/result/pdf/201604-e.pdf

    1. David leitch Avatar
      David leitch

      The contract price in Japan partly reflects old contracts, for instance ones signed with Woodside many years ago when prices were different. Those contracts have been renegotiated but still. The QLD LNG plants have signed contracts when oil prices were higher, basically at about 13-14%% of the value of oil. So if oil is US$50 this works to A$8.60-A$9.00 GJ and then you can net back the shipping costs to Australia and add on shipping costs to industrial customers.

      More to the point: (i) The LNG gas volumes are conracted so that’s where the gas volume is going. (ii) The market expects the price of oil to rise to over US$70 a barrel over the next couple of years, that’s based on flattish demand and the high cost of finding an producing marginal oil barrels. At US$70/b and US$0.7 the price of gas is A$12 or more.

Get up to 3 quotes from pre-vetted solar (and battery) installers.