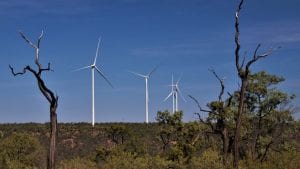
Duet’s share price will likely be driven by the success or otherwise of the ongoing growth program at EDL, its remote energy and clean energy segment. EDL has bought the Cullerin wind farm and is well placed to further expand in renewable energy, both in the grid connected and off grid segments.
DUE, like other regulated utilities, pays out all its free cash flow in the form of dividends (see Fig 6) and is relatively highly geared BBB- credit ratings.
Distributions in FY16 were 18 cents per security and management has guided to 18.5 cents ( a 2.7% increase) representing a yield of about 7% on the recent security price.
As for every regulated business the current appeal by the AER to Federal Court in regard to the “Ausgrid” decision will impact the cost of capital.
About DUE
DUE started life as a Maquarie Investment Bank stapled security (passive investment trust and operating company indivisibly stapled together) to hold regulated utility assets and externally managed. At one point it owned a minority stake in a USA regulated utility. Today though the business has evolved into a conventionally managed business that owns a combination of regulated and other infrastructure style utility assets. “Infrastructure” is code for asset intensive, low risk businesses.
In 2014 Spark Infrastructure [SKI] bought a 14% stake in DUE and talked about “consolidation” of the regulated utility sector. In July 2015 DUE bought 100% of the separately listed Energy Developments [EDL] business, effectively moving out of 100% regulated activities. Subsequently SKI switched its focus to Transgrid, privatised by the NSW Govt, and in May 2016 sold its interest in DUE back into the market.
The acquistion of EDL polarized DUE’s pre existing shareholders, some of whom didn’t like the different risk profile of EDL compared to the fully regulated assets. However on balance the sharemarket approved of the move as it put some growth back into DUE’s businesses.
Prior to the EDL acquisition DUE had two problems. (i) On the one hand its debt levels were at the higher end of what’s appropriate for a “yield based, safety first” style investment and rated BBB- negative outlook. (ii) DUE’s main asset was, and still is, the Dampier Bunbury gas transmission pipe in WA. This pipe had run into two problems, gas demand in WA was no longer growing, and the foundation tariffs that had supported expansion of the pipe were ending and to be replaced by lower regulated tariffs.
The acquisition of EDL was the largest part of a plan to resolve these issues. The other parts were to renegotiate some longer term contracts with the main shippers on the Dampier pipeline and to over raise equity for some smaller growth projects.
So as presented DUE’s business looks as follows:

The lower gearing of EDL is obvious, and reflects its perceived higher risk profile. Also noticeable is the low level of tax paid. If trusts distribute all their income, tax is paid by recipient. Finally SIB (stay in business) capex is mainly management’s interpretation, although for a regulated business it can be defined as being equal to regulatory depreciation, otherwise the value of the regulated asset base will decline.
Although often regarded as irrelevant for an infrastructure business we always like to look at the volume performance of the segments. In this case it shows that as for much of Australian energy there isn’t any volume growth. That’s a good thing for carbon management.

EDL
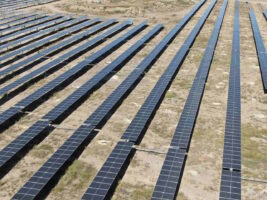
Pushs into renewable energy. EDL’s main claim to fame is it’s the largest supplier of off grid, that is remote energy, power systems in Australia. It supplies many of Australia’s mining communities typically in West and South Australia and in outback QLD and the Northern Territory. The overwhelming majority of this power is sourced from “reciprocating engines” fueled by either diesel or gas. This puts EDL in the frontline of understanding the value of PV, wind and storage as a replacement for expensive diesel. We have previously written about EDL’s Coober Pedy project, but we think there are many more opportunities.
EDL’s other line of business is waste coal mine gas to generation. This business has proved volatile from a profit perspective mainly because of changes to renewables legislation at both the Federal and State level. Still its given EDL plenty of experience in understanding the renewable legislation landscape.
Most recently EDL bought the 30 MW Cullerin wind farm from Origin energy for $72 m and EDL believes it can take advantage of CORPORATE LEVEL financing to achieve a cost of capital advantage over project sponsors who are looking at riskier project financing. We agree with management and see EDL as one of the better placed corporates to expand into this area. It doesn’t have retailer vested interests and it has a good balance sheet. If you are looking to get your project off the ground EDL might be an early point of call.
United Energy, electricity distribution in Victoria
Volumes are essentially flat with just a minor tick up in FY16

Still over the same period distribution revenue and the regulated asset base have continued to grow.

United Energy is similar to every other electricity distribution business in this respect. Essentially for investors this is the great thing about the business. Returns to capital are constant even if volumes fall. Were volumes to keep falling the model would break but for the time being it continues.
In fact DUE forecasts the following price rises for UE
Network Tariffs

Free cash flow yield
The current fashion in valuation is free cash flow [FCF] yield. FCF is not a Generally Accepted Accounting Principle [GAAP] term but its normally taken to represent cash flow to equity investors after paying all interest to external debt and after financing all capital expenditure. That remaining cash flow can be reinvested or distributed as dividends.
For regulated utilities though its expected that a portion of all capital expenditure will be debt financed. Essentially we look for a business to maintain a constant gearing ratio over time. In our view we allow the business to finance 100% of maintenance capex plus about 35% of growth capex in calculating free cash flow.
On our estimates DUE pays out all its FCF in the form of distributions (dividends).

David Leitch is principal of ITK. He was formerly a Utility Analyst for leading investment banks over the past 30 years. The views expressed are his own. Please note our new section, Energy Markets, which will include analysis from Leitch on the energy markets and broader energy issues. And also note our live generation widget, and the APVI solar contribution.