I thought I’d share some charts I’ve previously shared in articles and social media on the relationship between clean energy installations and your electricity bills, given it’s popped in the media again. Enjoy, friends.
The merit order effect
Something called the ‘merit order effect‘ means that as wind output in SA increases, wholesale price is reduced. These charts show price on the left hand axis (second chart is on a log scale), with wind output on the bottom axis. Each dot is a half-hour interval (thanks to NEM-Review for the data).


This is because clean energy doesn’t have fuel costs as it generates electricity – most of the costs arise when you build the machines. This lower cost option fills out the ‘cheap’ lower end of the stack, pushing out the more expensive fuels at the top. That’s why the blue marks slope downwards on the second chart – more wind = lower wholesale price.
Long-term wholesale SA prices
I recently wrote a detailed piece about South Australia on Medium – this is probably the key chart from it, showing the growth of wind in SA, and the entirely unexciting failure of SA wholesale price to jump higher in response.

Though some might find this disappointing, it highlights the complexity of the National Electricity Market, and the important fact that state prices are linked – recent price rises in SA have occurred at much higher levels in states with a much lower percentage of renewable energy.
Your power bill
Wholesale price, which I’ve shown in the charts above, is only one component in the bunch of factors that make up South Australian power bills. This is shown in the AEMC’s 2015 report:

Though clean energy pushes down the ‘wholesale’ (blue) part of those blocks, the RET scheme, which is designed to incentivise new build of clean energy, results in a small increase to you bill. You can see that the LRET component (for big wind farms and big solar – the ‘L’ stands for ‘large’) is $30 per year in SA, out of a $1,475 yearly bill – 2% of the total cost.
Is this higher in SouthAustralia, where there is a larger percentage of renewables? Last year, I compared SA’s 2014 data to other states:

It’s clear that South Australian retail bills aren’t impacted by the LRET any more than other states – something else is going on.
South Australian emissions
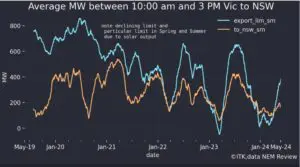
This often gets left out – it’s worth reminding ourselves that the complex effort of sourcing a large percentage of SA electricity from zero-carbon technology has paid off, with a noticeable reduction in SA emissions (the dark grey line below), which thankfully hasn’t been offset by the import of carbon-intense power from Victoria:

The NEM is a complex system, which goes some way to explaining why it’s such fertile ground for confused and misrepresented claims. Hopefully, this simplifies it, a little.
Ketan Joshi is a communications consultant working with emerging clean energy technologies. You can follow him on Twitter at @KetanJ0.