It’s official: Australia now hosts 1.5 million solar power systems. That’s equivalent to 18% of Australian households owning a PV system. Based upon SunWiz’s analysis of Clean Energy Regulator data held in the REC Registry, Australia registered its 1,500,000th PV system on the 22nd December 2015.
To celebrate, SunWiz – Australia’s leading provider of Solar Market Intelligence – is showering you with solar data and charts.
- Australia’s solar installers have been busy. Since 2001 they’ve installed over 23.2 million solar panels. This means there’s now a solar panel for every man woman and child in Australia.
- Australian solar ranks amazingly well internationally:
- Australia has some of the lowest system prices in the world, thanks largely to a highly efficient workforce
- Australia has the highest in the world number of installations per inhabitant – Australians love solar power on their roof more than any other country.
- Australia ranked 8th in the world for capacity installed in 2014, and is likely to be a top-10 country for installed capacity in 2015
- PV contributes over 2.5% of Australia’s electricity needs.
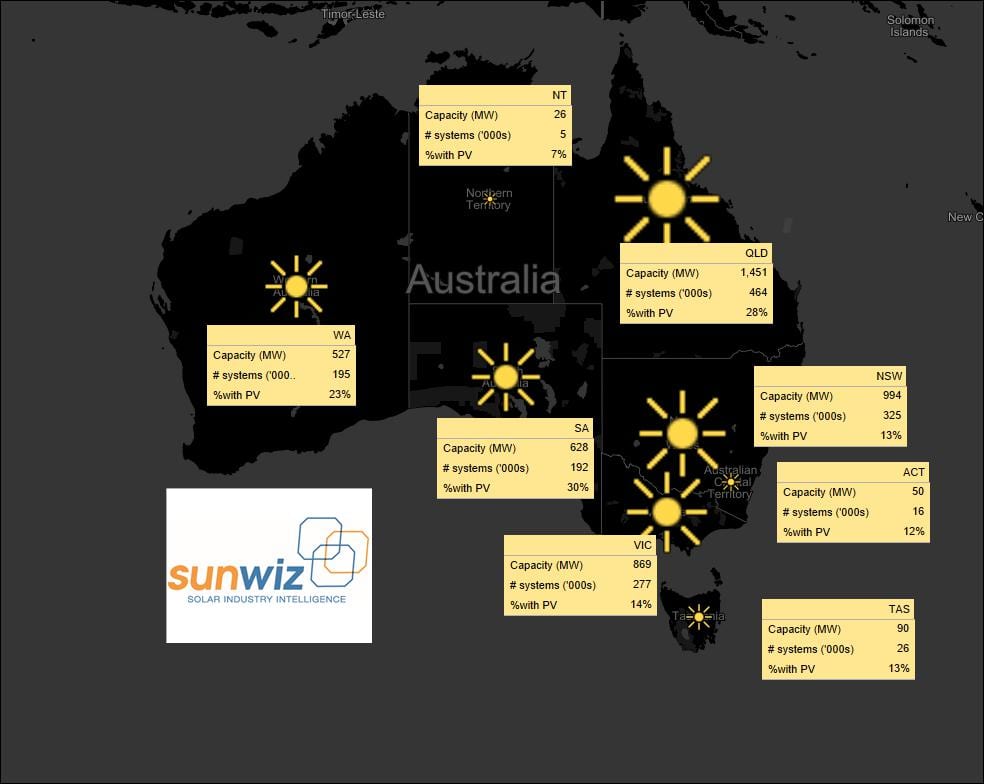
- Queensland hosts the most solar power systems in the country, over 450,000 in total, representing 28% of households. South Australia has a similar proportion of dwellings with PV (30%). By contrast only 5,000 have been installed in the Northern Territory (7% of households). There is almost 1.5GW of PV in Queensland, and almost 1GW in New South Wales.
| State | #systems | %with PV | Installed MW (of sub 100kW systems) |
| ACT | 16,371 | 12% | 50 |
| NSW | 325,406 | 13% | 994 |
| NT | 5,157 | 7% | 26 |
| QLD | 463,993 | 28% | 1,452 |
| SA | 192,318 | 30% | 628 |
| TAS | 26,141 | 13% | 90 |
| VIC | 276,594 | 14% | 869 |
| WA | 194,704 | 23% | 527 |
| Grand Total | 1,500,684 | 18% | 4,635 |
- The rate of installation has fallen off since the peaks of 2011 and 2012, when over 300,000 systems were registered each year. Half that number (150,000) were registered in 2015, as seen in the chart below. The peak years occurred because people rushed to get in before subsidies wound back, whereas in recent years the incentive schemes have been stable so buying a PV system wasn’t such an urgent need.
- However, the drop-off in installed capacity has been less severe than the fall in the number of installations. This is , because of a trend towards larger residential systems and an increasing volume of commercial projects. The chart below shows volume of sub-100kW PV systems registered each year. The peak year was 2012, with almost 1000MW of PV registered. 2015 was a significant contraction on the previous year, with only 718MW registered.
Though there was a falloff in volume in the sub-100kW segment, 2015 was a bumper year for large-scale solar, as illustrated by the chart below.
- Over 226MW of installations larger than 100kW were installed, five times as much as installed in 2014 (43MW).
- Don’t expect a repeat of this in 2016 – last year’s figures represented the culmination of the Solar Flagships program first announced in 2009.
- That said, there are ongoing programs that will deliver new utility-scale installations in coming years. Ergon has a 150MW tender, and ARENA has $100m of funding for large projects.
- All up, there is a total of 320MW of large-scale solar operating in Australia. SunWiz’s radar has 785MW worth of announced projects that may see the light of day.
When the sub-100kW and >100kW segments are combined, the tally for 2015 was 935 MW, 11% higher than 2014. The chart below breaks down the installed capacity into sectors: residential (blue), small commercial (orange), medium commercial (grey), large commercial (yellow), industrial (navy), and utility (green), and – to show a truer picture of the industry’s ups and downs – the horizontal axis is year of installation rather than year of registration.
- It is immediately apparent that the market for residential solar is significantly contracting, 17% down on last year.
- The market for small commercial has grown slightly, 9% higher than last year
- Medium commercial has grown a similar amount (12%).
- Large commercial has actually shrunk by 45%, most likely due to uncertainty caused by the RET Review affecting Large-scale certificate prices
- Industrial PV grew by 90%, and utility PV grew 8-fold.
- What will 2016 hold? SunWiz expects that the residential market will contract, though only slightly. There will be continued 10-20% growth in the small and medium commercial sectors, and significant expansion of the large commercial and industrial sectors. There won’t be as much volume of utility scale projects installed in 2016, as the focus will be upon earlier stages of project development, with utility-scale project deployment starting in earnest in 2017 and growing from there.
Source: SunWiz. Reproduced with permission.


