![]() The rapid changes to the electricity system being wrought by distributed solar have utilities crying out, and they’ve poured much of their distributed solar angst into a chart being shared throughout the energy nerdocracy – the duck.
The rapid changes to the electricity system being wrought by distributed solar have utilities crying out, and they’ve poured much of their distributed solar angst into a chart being shared throughout the energy nerdocracy – the duck.
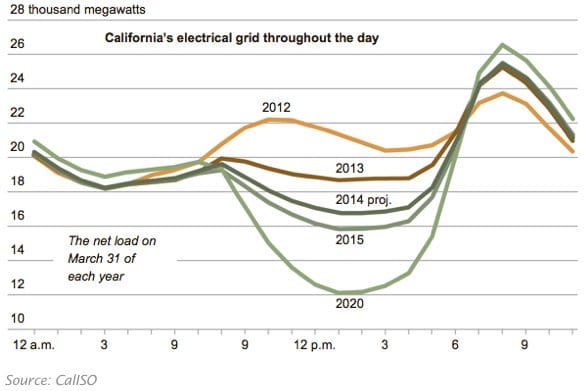
The Duck Chart, Showing Net Supply/Demand on the California Grid in 2012-13, Forecast through 2020

The duck is the perfect vehicle for utility complaints because it casts the growth of distributed solar as a major technical problem (an area where most policy makers defer to utilities) rather than an economic one, where utility complaints can be contrasted with their customer’s desires for more local control over their energy use and costs.
The utility companies crying “fowl” highlight a particular part of the duck chart: the dramatic ramp up in power generation on the light-green 2020 curve that happens in the late afternoon, as energy produced from solar wanes but energy demand rises. In the traditional grid operating model, accommodating this ramp-up in energy use requires a lot of standby power from expensive to operate, rapid-response power plants.
Evidence suggests utilities are crying “wolf,” with several experts poking large holes in the utility argument. The Clean Coalition and Regulatory Assistance Project have both offered numerous strategies utilities can use to “flatten the duck” or “teach it to fly:”
- Target energy efficiency measures for the “ramp up” period
- Orient solar panels to the west to catch more late evening sun
- Substitute some solar thermal with storage for solar PV [I’d suggest adding storage to PV also works]
- Allow the grid operator more demand management via electric water heating [already done extensively by rural cooperatives in Minnesota]
- Require large new air conditioners to have two hours of thermal storage accessible to the utility
- Retire inflexible generating plants (read: coal and nuclear) that need to run constantly in off-peak periods
- Concentrate utility demand charges on the ramp up period.
- Deploy electricity storage into targeted areas, including electric vehicle-to-grid
- Implement aggressive demand response programs (subscribing more businesses and homes into programs to shed their energy demand at key periods)
- Use inter-regional power transactions
- Selectively curtail a small portion of solar power generation
In other words, the technical challenges of the duck are manageable, largely with existing technology.
The economic problems for utilities – stemming from an outdated business model – may not be so manageable.
More solar generation serving peak afternoon loads will out-bid competitors – utility-owned peaking gas power plants – because solar has zero fuel cost, so utilities will lose money even as customers save money. By 2020 in the California example, solar production at noon will also be sufficient to cut into power usually provided by so-called “baseload” power plants (e.g. coal) that are only economic when operated round-the-clock. The problem for utilities is that they’ve continued to pour money into a twentieth century grid system (inflexible, centralized power plants with long-distance transmission lines) even as the grid has been transformed by distributed, local renewable energy.
Utilities point to the duck chart as evidence that renewable energy development should be stopped on technical grounds. But it’s in the belly of the beast we find the real utility problem: energy demand displaced by solar represents lost market share for utilities as their customers switch to sunshine.
To paraphrase Mark Ferron, recently retired from the California Public Utilities Commission: it’s open season on the utility’s duck.
Source: ILSR. Reproduced with permission.