Solar rush continues in Qld, as Newman plans asset sales

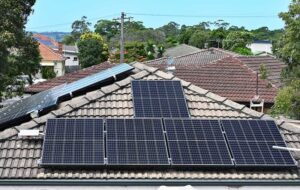
The rush of Queensland households towards rooftop solar – even with minimal subsidies and incentives – continues unabated with  another 3,687 new rooftop solarPV systems metered by Energex in the month of May, adding 16.2MW of solar capacity to the grid.

The uptake of rooftop solar is now the highest in the south-east of the state (the area managed by Energex) since the Queensland government slashed the feed in tariff from 44c/kWh to 8c/kWh in 2012.

Energy experts say it is being driven by the continued surge in electricity prices (it will rise 21 per cent in Queensland in 2014/15, thanks to rising gas and network costs), which are overwhelming any energy efficiency savings. The relatively high tariff of off-peak electricity (20c/kWh in the evening) is also encouraging maximum self consumption of rooftop solar output.

As this graph below shows, the green line is the number of new systems metered under the 8c/kWh tariff, while the red line shows the combination of that number, and those who have transferred from the 44c/kWh tariff – probably because they sold their house or expanded their system. They are represented by the blue line. So far 12,500 systems have come off the 44c/kWh tariff.

energex systems

All this happens as the state government announces plans to sell its generation assets, and to bring in private investors to co-invest with the transmission and distribution companies.

The sale of generation assets will be interesting, as the likes of Stanwell Corp has blamed the impact of rooftop solar on its inability to generate a profit last financial year. CS Energy faces similar challenges.

The attraction of rooftop solar also poses interesting challenges for the network operators. Part of the challenge of solar is being addressed because commercial users are being encouraged to install “export limiters’ which means that they will consume the solar output on site when they can, and won’t flood the grid on holidays, for instance.

But the popularity of solar also means that network operators need to think differently about network upgrades, looking to battery storage and distributed generation rather than more poles and wires. For that reason, the decision by the state government may open the way for a new breed of partner to enter the business – battery suppliers for instance. If that is the plan, then that is a potentially very good development.

This graph below highlights the amount of rooftop solar capacity installed under the 8c/kWh tariff was introduced. It is now more than 181MW. Incidentally, that tariff reduces to zero (or a voluntary payment by the retailer) next month, so it will be interesting to see what happens then.

energex installed capacity

The last graph shows the combined solar PV capacity in Queensland, which is now at 1.157GW as at the end of April. That makes it the fourth biggest generator in the state.

energex power


Comments

8 responses to “Solar rush continues in Qld, as Newman plans asset sales”

  1. Stan Hlegeris Avatar
    Stan Hlegeris

    All of these threads are tied together by the Queensland Competition Authority’s ruling on electricity prices from 1 July 2014.

    The key detail: the fixed daily charge. This rose by 92% on 1 July 2013 and will rise by an additional 66% on 1 July 2014. It has more than TRIPLED in two years, from $108 to $335 per year, for each and every electricity connection.

    That’s an extra tax of $227 per connection per year devoted entirely to propping up the obsolete coal-fired, grid delivered electricity system.

    It also helps to prop up the otherwise negligible capital value of the generating assets. That value can only derive from the ability of those assets to deliver revenue. Now that they will never again be able to compete with renewables on cost, they have no capital value.

    To sell these assets, Queensland will have to guarantee the revenue. So watch for lots more big increases to the fixed connection charge.

    1. Gramus Avatar
      Gramus

      No Stan… The increase in fixed charges is significantly due to Solar Bonus Scheme costs being recovered.

      From the QCA

      “The second major cost driver is the Queensland Government’s Solar Bonus Scheme (SBS). The scheme’s costs have almost doubled since 2013‐14 and will continue to push up prices in future years as distributors recoup costs incurred in paying feed‐in tariffs to solar customers. The scheme’s impact on network tariffs is expected to peak in 2015–16, at which time about 34% of Energex’s network prices will be due to the SBS.”

  2. Gramus Avatar
    Gramus

    You neglect to mention that the costs of the Solar Bonus Scheme are driving power prices up in QLD… From the QCA

    “The second major cost driver is the Queensland Government’s Solar Bonus Scheme (SBS). The scheme’s costs have almost doubled since 2013‐14 and will continue to push up prices in future years as distributors recoup costs incurred in paying feed‐in tariffs to solar customers. The scheme’s impact on network tariffs is expected to peak in 2015–16, at which time about 34% of Energex’s network prices will be due to the SBS.”

    QCA http://www.qca.org.au/getattachment/25696fbc-b4ed-42c4-8d16-fd3efddb563e/Final-Determination.aspx

    1. JohnRD Avatar
      JohnRD

      Gramus The QCA was a flawed document that found excuses to ignore all the savings that were flowing from rooftop solar. If these benefits had been included the FIT would have to have been above 100 cents per kWh before solar would have actually been driving up household power costs. See: http://www.climateplus.info/2014/04/13/comments-on-qca-report-on-feed-in-tariffs/ AND https://reneweconomy.wpengine.com/2012/why-utilites-will-pay-a-premium-for-rooftop-solar-72585
      There was also no attempt to work out how much lower current household power prices would be now if strategically located solar had been used to avoid the need for grid upgrades.

  3. RobS Avatar
    RobS

    Looking at the last graph we are one year from solar becoming the number 2 generator in the state and about 2 years from the number 1 spot.

  4. Donnie Avatar
    Donnie

    Can anyone explain if the Last graph is Gross or Net flow in?

    If its Net then the generation will be a lot bigger.

    1. Jonathan Prendergast Avatar
      Jonathan Prendergast

      Gross capacity I think. Capacity rather than generation or flow.

  5. Ian Avatar
    Ian

    The average feed in tariff for solar installed in Queensland, using the article above is 35c/KWH, the cost of the tariff 11 with GST is close to 30c/KWH, not a great deal of difference. If tariff 11 goes up 21%, the cost will be 36c/KWH, this means that solar is no longer subsidised by non-solar consumers. In fact every month the proportion of 44c legacy FIT compared to 8c becomes less , as people continue to install solar and as others lose their illegibility for the 44c FIT. House holders are required to pay a fixed charge for each connection, this is to reflect the cost of poles and wires. This would all suggest to me that solar householders are, or soon will be , subsidising non-solar consumers. This is totally unfair, and an affront to hard working Australians!

Get up to 3 quotes from pre-vetted solar (and battery) installers.