One of the greatest challenges facing the electricity industry is comprehending how much solar power is installed, how well it is performing, and thus how it is affecting the electricity market. SunWiz invests an extraordinary amount of time in understanding the metrics of the PV industry, collating and reconciling information from a wide range of reputable sources.
One of the key challenges is interpreting the monthly installation figures when it can take up to 12 months to register a system for STCs. In-depth analysis of the REC Registry provides information on installation registration date but not installation date; analysis of CER data provides installation month but this data lags far behind the REC registration due to the STC audit process.

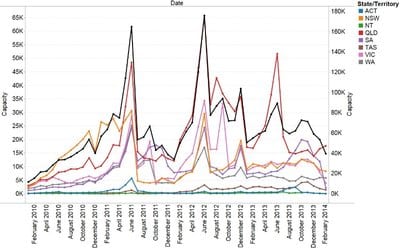
(source: analysis and projection from CER data)
As part of its Solar Hot Spots package, SunWiz has developed a rudimentary projection of installation data from the CER datasource. The figure below shows the data provided by the CER; incomplete data particularly in the most recent month(s) gives the impression of a perilous demise of the PV sector. Our projection, based upon in-depth analysis of historical CER releases transforms this data into something more useful.
Noting the siginficant uncertainty around the most recent month’s installations, we can clearly see the massive drop in installation activity in South Australia. This is to be expected, following the end-January installation deadline for feed-in tariff systems, which contrasts with Queensland’s recovery from its own FiT wind-back.
Though it is too soon to tell for sure, fall-backs may also have occurred in Victoria and New South Wales over the December and January period, though this is also affected by reduced working days due to summer vacations and public holidays.Should these figures be correct, Australian PV is having results as poor as occurred at the end of 2011.
Monthly Registration Volumes
Month-by-month registration volumes have been largely steady since our last broadcast in December. After 72MW was registered in November, December and January were quieter at 62 and 59 MW respectively, though this was at least partly affected by summer break and public holidays. February returned to a 74MW of installations.
Top Postcodes for 2014
Thus far the top 10 postcodes for PV in 2014 are mostly in Queensland, though Western Australia has 2 of the top 5 placings. However, as far as Local-Government regions go, the top 5 for 2014 are all in south-east Queensland. Overall, Brisbane local government has the greatest PV uptake nationally; Onkaparinga leads SA, Casey leads Victoria, Wanneroo leads WA, and Blacktown leads NSW.
STC Target, Trading, and Surrender Volumes
The 2014 STC target of 18.65m certificates is half of the 2013 target, meaning that the SRES will reduce electricity bills in 2014, both due to the lower target and by reducing wholesale electricity prices. When compared to earlier years, STC surrender volumes indicate that the big three electricity retailers all lost market share in 2013; ERM picked up significant market share, as did Red Energy, Simply Energy and (though smaller players) so did Qenergy, Click Energy, and Dodo power and Gas.
Commercial Trends
The shift to commercial PV in the small-to-medium range is evident, with 17% of installed capacity in falling into the 10-100kW range. Despite the end of the South Australian Feed-in Tariff, most of 2014’s commercial capacity is still being installed there. When Western Australia installs commercial PV, it puts in bigger systems than the rest of the nation, averaging 23kW for any installation that exceeds 10kW in size.
Warwick Johnston is head of consulting firm SunWiz. For pricing and more information about his reports, go to https://www.sunwiz.com.au/index.php/solar-market-intelligence.html.