It’s a pretty consistent theme on RenewEconomy, but given the apparent ignorance in the mainstream media, it’s worth banging on about: solar energy is delivering cheap energy to Australia’s home and businesses.
Here a few graphs that bring some new insight into the falling cost of rooftop solar PV in Australia – both for households and for businesses.
They were prepared by Patrick Greene, the business development manager for solar developer Ingenero at the 2XEP conference in Sydney. Some will be surprised by their conclusions.
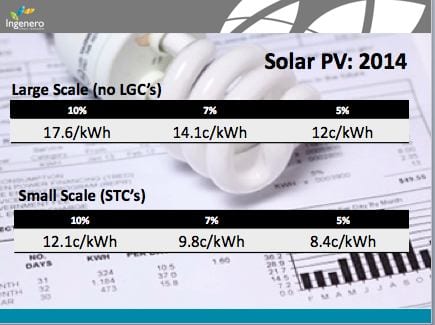
Greene fed his calculations into the NREL online calculator to come up with estimates for the levellised cost of energy for rooftop solar at commercial scale rooftops (100kW or more), and for smaller rooftop systems.
It gives three figures on LCOE (levellised cost of energy), based on various estimates of the “discount rate” – the value of money over time – with around 7 per cent being about the standard. At this rate, and not including large scale renewable energy certificates, the LCOE of rooftop solar is 14.1c/kWh.
The second number shows what it means for smaller systems, which get another form of certificate, known as STCs, as an upfront payment. According to Greene’s calculations, the value of solar is now below 10c/kWh. To get the subsidy free price would require adding about 30 per cent back into the cost.
“People are told that solar is too expensive,” Greene says. “But we have seen a staggering reduction of the cost of solar in the last couple of years, so I hope that these graphs frame what the actual cost of solar is.”
For what this means for people installing solar on their rooftops, the next two graphs are instructive.
The first shows the payback on a smaller system, one that qualified for STCs, for a business in Adelaide currently paying 33c/kWh for grid based power. The payback is less than four years.
The next graph is for a larger system for a bigger user that gets a cheaper rate from the local utility – 15c/kWh. The installation still saves money, but it is a much longer payback, possibly too long for many businesses.
All of this is causing some fierce push-back from the utility industry. Greene and other speakers cited numerous ways that distributors are seeking to slow down the uptake of solar – one is by drawing out the application process (taking 65 business days for each amendment or query), requiring systems to be installed to stop exports back into the grid, or simply refusing the installation.
That, of course, leads to users thinking that they might be better off without the grid. How far is that away?
Ingenero’s Greene used this graph below to show that it was not as far off as some people think. It is from the Vector Energy offering in New Zealand, where the local distributor is offering solar plus storage packages on leasing arrangements with their customers. (Vector is doing this to avoid having to build new poles and wires).
The key figure comes in this table. Look at the bottom line, it is for the system with 5kW of solar and 12kWh of battery storage. That’s enough to look after all the needs for the average Australian house. The cost: $3,000 upfront and $115 a month.
It is likely subsidised to some extent by Vector under their trial, but it shows that solar and storage is not far from being a viable solution. And that, may just turn the industry on the head – instead of utilities dictating tariffs to consumers, it might be the consumers (with a viable alternative) that can dictate terms to the utilities. Imgine that.


