A new online modelling tool allowing households to estimate their rooftop’s potential for solar PV – and to weigh up the energy and cost savings from installing rooftop solar – has been created by the Australian PV Institute.
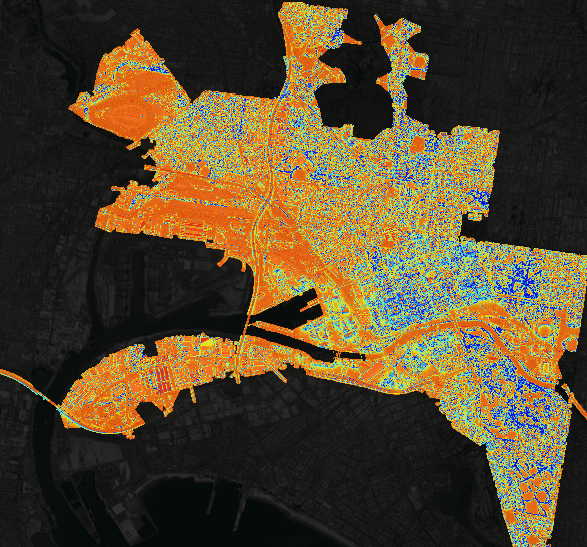
The 3D Solar Potential Tool, part of a suite of updates to APVI’s Australian Solar Maps launched last Friday, was developed with $436,000 of ARENA support, and allows users to estimate output from a PV system on rooftops in capital cities, as well as financial savings and emissions offset.
The tool accounts for solar radiation and weather at the site; PV system area, tilt, orientation; and shading from nearby buildings and vegetation. Users can then alter the design of the system and adjust the feed-in tariff to improve the accuracy of savings estimates.


Also launched last week was a Solar Animation tool, showing the evolution of the PV market in Australia. The CER data on the Solar PV Status and Market Analyses was also updated and a new PV Postcode Data tool has been added for postcode level analysis.

According to ARENA, more than 19,000 people had already visited APVI’s solar map website at the start of last week.
APVI CEO Lisa Miller said the maps are important resources for understanding the increasing role of PV in Australia, incorporating live generation data, historical information and interactive tools.
“This map is an important part of the work of the APVI to support the increased development and use of PV via research, analysis and information,” said Miller.
The new modelling tool and solar maps are available online: pv-map.apvi.org.au