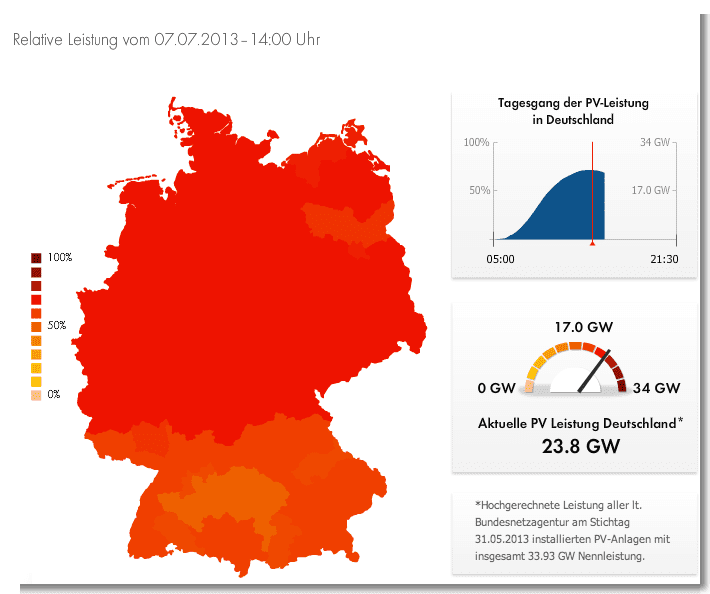
It has been a very sunny day here in western Poland, so I knew it was basically the same in Germany (it always is) and that there was a good chance Germany would break its previous solar power output record. So, I’ve been keeping an eye on SMA Solar Technology’s live solar power output tool for the country.
Screenshot of SMA Solar Technology live solar power output webpage.
Sure enough, a few hours ago, solar output climbed above the 22.68 GW solar power output record Germany set in April. Not long after, it climbed above the 23.4 GW solar power output record set in June. At its peak at about 1:45pm local time (one hour ago), the output got up to 23.9 GW. (Actually, I thought I saw it reach 24 GW at that time, but the replay isn’t showing it go above 23.9 GW.)
I’m sure an official number still needs to be confirmed, but a full 0.5 GW increase according to SMA’s site makes for a very safe conclusion that we have a new record. It is an estimate based on the output of thousands of SMA solar power systems spread across the country.
Germany’s peak electricity demand at midday is about 60 GW, so at 1:45pm or so, solar power was providing about 40% of the country’s electricity demand. Impressive. Approximately 1.3–1.4 million solar power systems were involved in creating that massive electricity output, our German solar expert Thomas tells me. And about 8.5 million people live in buildings where solar power systems are used to produce electricity or heat.
As we’ve reported many times before, Germany is the clear solar power world leader at the moment. (Though, Bulgaria and the Czech Republic actually beat it on solar power per GDP). Despite what Fox News or Fox & Friends might want to tell you, it’s not because of Germany’s “excellent” solar resources — its solar resources are comparable to Alaska’s. Rather, it’s because the country has had a simple, strong policy in place (solar feed-in tariffs) to stimulate solar power installations on homes and businesses.
Note from Ed: We checked on the energy transparency web-site, which suggested that at 1pm, when solar was providing 22.4GW, it was providing just over 45 per cent of the electricity, with wind providing 1.2GW, and conventional generation 25.9GW.
See the graph below:
This article was first published at Cleantechnica. Reproduced with permission.


