It’s been a bad week for wind energy in Australia, one of the worst ever according to renewable energy and market analysts. And it has prompted fierce debate on social media, mostly by renewable antis and pro nuclear ideologues who declare it to be proof that a grid cannot run on wind, solar and storage.
According to Watt Clarity, one of the more sober observers of the National Electricity Market, aggregate wind production has been under 10.5% of NEM grid demand for a prolonged stretch that – by Tuesday this week – was well into its 6th day.
Data from the OpenNEM widget confirms that the share of wind energy for the past seven days in the NEM has averaged just 5.9 per cent. That compares to an average of 10.7 per cent over the past month, and 13.1 per cent over the past 12 months.
It has reignited conversations about long term “wind droughts”, what the Germans call “dunkelflaute”, and whether a grid dominated by renewables will have the resources – in the form of storage or other readily dispatchable capacity – to meet consumer demand.
It’s a well recognised issue, although the debate has become particularly fierce in the light of the Coalition and conservative media push for nuclear power, and their demands that coal fired power stations be kept open and new large scale renewable energy projects brought to a halt to “stop the lights going out.”
Proponents of the transition to renewables say that getting to very high levels of renewables – and in Australia that means variable sources of wind and solar – should not be that difficult.
It is meeting the last 5, 10 or 15 per cent of demand that is the most problematic. Most agree that gap will need to be filled by fast and flexible capacity. And if not battery storage or pumped hydro or some other long duration storage such as compressed air or solar thermal, it will have to be peaking fossil gas, or a cleaner version of it.
David Osmond, an engineer who works at renewable and storage developer Windlab, has for the last three years been running a simulation of the output of wind and solar in the NEM – using real time data – and working out how much storage would be required for a renewables dominated grid.
“A key point of my simulation was to show that a 96%-99% renewable grid may be much more feasible than people realised,” Osmond wrote in an article for Renew Economy last year.
His analysis was based around upscaled wind and solar with enough capacity to meet an average 105 per cent of annual demand. The challenge was how much it could deliver on a half hour basis.
His studies show that using just 24GW and five hours storage (120GWh), the upscaled wind and solar supply would have achieved 98.8 per cent of demand – down to half hour periods – over the year at an average cost of $95/MWh, including the cost of additional transmission, storage and curtailment.
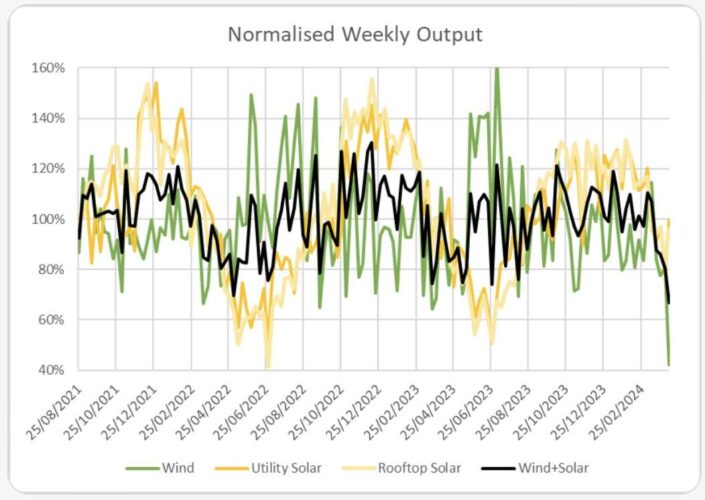
Osmond says that the past week has been the worst for wind energy “by a long way”, and delivered just 42 per cent of the annual average for wind output.
“The previous worst was 64 per cent,” he writes on a X/Twitter thread where he shares the results of his simulation. “Solar was very close to average, sunny weather making up for shorter days. Wind+Solar was 67 pct of annual average, also a record low, (previous worst was 70 pct).

Despite all that, Osmond says his simulation shows that with 24 GW/120 GWh of storage, and the upscaled wind and solar would still have delivered a 96.8 per cent share of renewables to meet demand over the past week, calculated on a half hour basis.
That share was helped by the fact that demand was also four per cent below average, Osmond said, because of the mild conditions, and possibly school holidays in several states.
“April tends to be the worst month of the year for NEM wind, typically (it is) 80 per cent of the annual average,” Osmond wrote on Twitter/X.
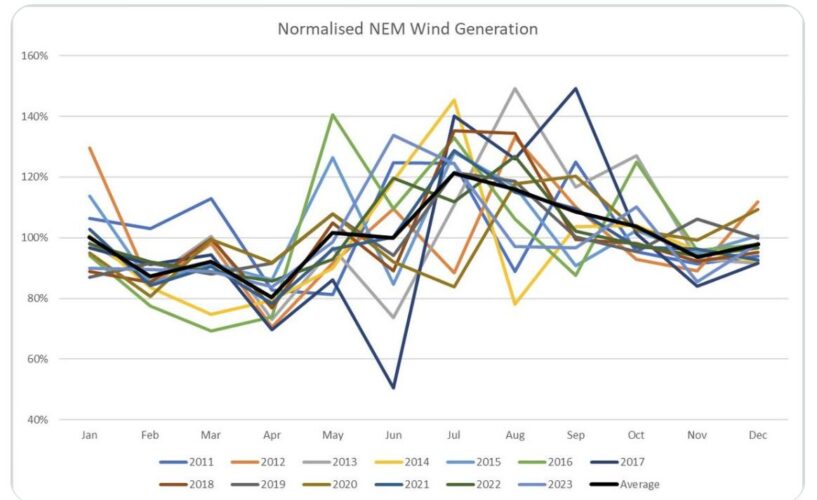
He told RenewEconomy that the principal reason for the high share of renewables in the past week was that there were “no shocker” days. “It was just consistently bad for the whole week, so hydro was able to fill most of the shortfall,” he said.
“The worst weeks tend to have two or more shocker days, where hydro falls a long way short of filling the gaps. (I limit hydro to 6 GW).
“But since this week didn’t have any really bad days, hydro was able to fill most of the gaps, meaning an overall result of 96 per cent.
“(That is) much better than others that have got down to 90 per cent, despite have the worst week for wind and solar.”
year.

