Records have tumbled again across Australia’s main grid in the past few days, with new benchmarks set for the share of renewables, the share of wind and solar, the lowest level for coal, and output records in multiple states.
The new records tell an uplifting story of the continuing renewable energy transition in Australia, but also point to some of the deficiencies, with record levels of enforced curtailment of wind and solar in South Australia speaking to the investment needed in storage, load management and new technologies such as green hydrogen.
Saturday was the scene of multiple records, with the share of renewables in the National Electricity Market, the main grid that includes all states except Western Australia, leaping to 64.34 per cent at 10.45am on Saturday, bettering the 62.94 per cent level reached just two days earlier.
On Sunday, that records was broken again, with the share of renewables jumping to 64.6 per cent at 10.45am.
Other records identified by data analysts GPE Nemlog2 include the share of wind and solar (i.e. not including hydro), which reached a new peak of 61.84 per cent at 12.05pm, beating the previous peak of 60.95 per cent set on November 11 last year. It was bettered again on Sunday, to a new peak of 62.27 per cent.
Wind alone hit a new record high share of 35.92 per cent early on Sunday morning.

The corollary to these new benchmarks were record lows for coal (down to 34.16 per cent, from 36.31 per cent a day earlier, highlighting the scale of new records) and for fossil fuels (coal and gas), which fell to 35.59 per cent.
There were new record lows for coal output and for coal and gas, which fell below 9,000MW for the first time to set a new low of 8965MW, significantly below the previous low of 9245MW set in October last year.
The new records are an inevitable result of good sun and wind conditions, and the number of additions to the grid of large scale wind and solar farms over the past year, not to mention rooftop solar.
The maximum share of wind and solar in the main grid is still short of the average share of wind and solar in the state of South Australia – which leads the world in the adoption of “variable renewables” with an average share of 64 per cent over the past year.
But a day after the state set a new instant share of renewables of 146 per cent – when it was able to export one third of its output to Victoria – came a record level of curtailment, when the state was unable to export much excess capacity and local demand was low.
According to GPE NemLog2, the level of curtailment of wind and solar hit a record high of 1445MW at 1pm on Friday, much higher than the previous high of 1351MW set in late August.
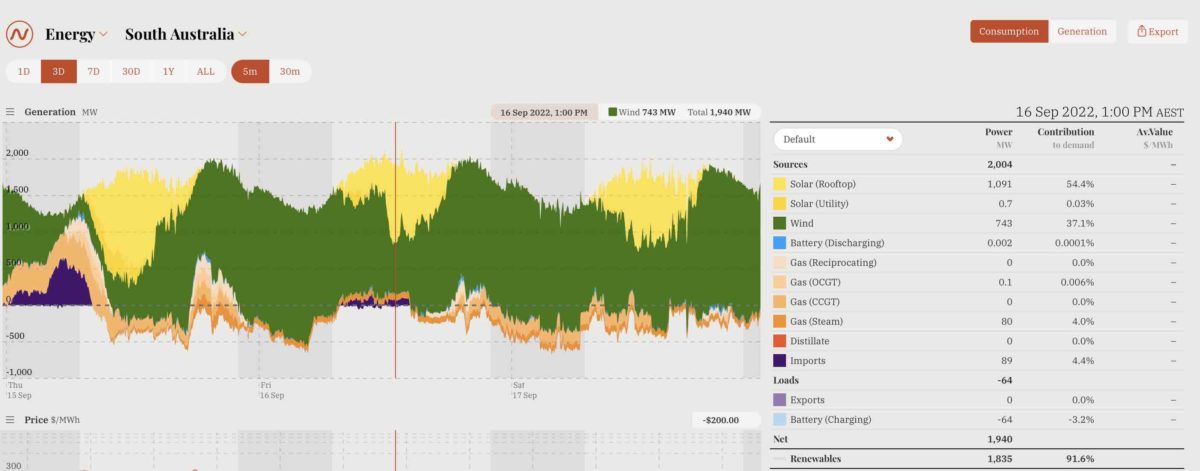
This graph shows that demand was relatively low, and rooftop solar was soaking up much of that. Exports to Victoria were reduced, probably because that state was well served by its own renewables, which had hit a new high of 84 per cent earlier that morning, and also network constraints.
As the amount of wind and solar increases, and the average share of renewables also surges towards 100 per cent of local demand in South Australia, it points to the growing need of storage in the state, and the opportunities for green hydrogen and other “loads” that could soak up that excess capacity.
See also: “Remarkable;” South Australia may soon be first big grid to run on renewables only