French investment bank Kepler Chevreux has produced a fascinating analysis that has dramatic implications for the global oil industry.
It estimates that $100 billion invested in either wind energy or solar energy – and deployed as energy for light and commercial vehicles – will produce significantly more energy than that same $100 billion invested in oil.
The implications, needless to say, are dramatic. It would signal the end of Big Oil, and the demise of an industry that has dominated the global economy and geo-politics, for the last few decades. And the need for it to reshape its business model around renewables, as we discuss here.
“If we are right, the implications would be momentous,” writes Kepler Chevreux analyst Mark Lewis.
“It would mean that the oil industry faces the risk of stranded assets not only under a scenario of falling oil prices brought about by the structurally lower demand entailed by a future tightening of climate policy, but also under a scenario of rising oil prices brought about by increasingly constrained supply. “
The main argument from Lewis is that oil prices could stay so low that it is no longer economic to bring in high cost new oil fields. But even if the oil price does rise, it will not be able to compete with renewables such as solar and wind.
The most striking conclusion is that by using wind or solar to charge electric vehicles, more energy is produced per dollar invested than with oil – in the case of onshore wind, it is four times as much energy for the same amount of money.
So how does Lewis produce his numbers?
He has developed a new concept of the energy return on capital invested (EROCI) for a potential outlay today of $US100bn. He asks how much energy would $US100bn purchase if invested in oil on the one hand, or in solar PV and wind energy on the other?
Table 1 above shows our calculations for the amount of gross and net energy that can be obtained from investing $US100bn in 2014 (i.e. based on current economics). In all cases, the calculations are based on a one-off investment with no reinvestment taken into account.
He defines gross energy as the amount of primary energy available before it is converted into useful energy in final consumption. Net energy, however, is the amount of energy available for final consumption after taking into account energy conversion and energy transmission losses. This includes the energy available for powering oil-fired cars and electric vehicles.
For oil, he has assumed investment opportunities in new projects with full breakeven costs (all- in capital costs, operating costs, and any royalties payable) of $US75/bbl and $US100/bbl, as these cover breakeven cost levels in the upper quartile of the industry cost curve and will account for a very significant share of the new investment opportunities. He assumes two different potential lifetimes for new oil projects (ten and 20 years), as some projects (e.g. deep-water) have shorter lifetimes than others (e.g. conventional onshore and oil sands).
For renewables, he assumes capital costs of $US3bn/GW for solar PV (Ed: seems high), $US1.5bn for offshore wind, and $US4.5bn/GW for offshore wind. He assumes annual load factors of 13% for solar, 25% for onshore wind, and 40% for offshore wind. All renewables investments are assumed to have project lifetimes of 20 years. (ED: In Australia, solar has a load factor of 18 per cent, wind is more than 35 per cent).
As table 1 shows, the gross energy of oil is higher than all the renewable sources over a 10 year period. But over 20 years, the relative economics of renewables improve, and onshore wind actually yields slightly more gross energy annually over 20 years than oil at a price of $US75/bbl and nearly 40 per cent more than oil at $US100/bbl (117TWh versus 85TWh).
However, if the analysis takes into account net energy yield, and the growing take-up of electric vehicles, then the picture is markedly different.
Internal combustion engines lose 75-80 per cent of the energy value of the oil input, while for EVs, converting electrical energy into battery-stored chemical energy and then back into electrical energy loses 25- 30 per cent of the original power input.
Lewis has therefore assumed a net energy yield from oil of 25%, and a net energy yield from renewable electricity for use in EVs of 70%. He has also adjusted for transmission losses – 2.5% transmission losses for solar PV, 5% for onshore wind, and 7.5% for offshore wind.
This means that the net energy yield for EVs powered by solar PV is here assumed to be 67.5%, for EVs powered by onshore wind 65%, and for EVs powered by offshore wind 62.5%. He assumes 10% capital-cost reduction in real terms by 2035 versus 2020 for wind, and for solar PV and offshore wind cost reductions of 15% to 2020 and a further 15% to 2035.
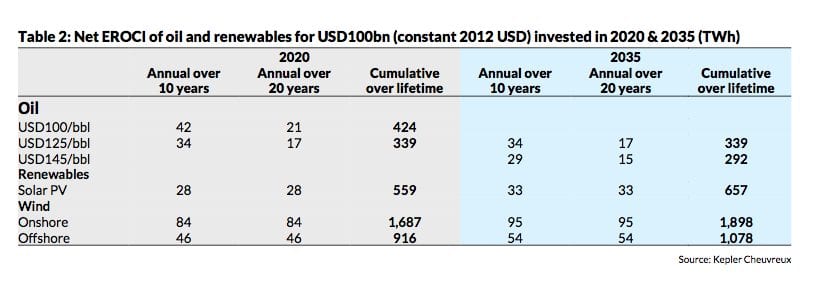
The picture of net energy yield is remarkably different, as can be seen on table 2 (below).
By 2020 all renewable technologies have a significantly superior net EROCI to that of oil at both $US100/bbl and $US125/bbl. “It is almost impolite to compare the net EROCI of oil with that of renewables by 2035,” Lewis notes.
Indeed, by that date, solar will be producing double the energy yield of oil for the same amount of money. For onshore wind, the amount of net energy produced will outstrip oil by a factor of nearly 6:1.
“Of course, there remain huge infrastructure challenges to be overcome – and paid for – if EVs are to realise their potential over the next two decades,” Lewis adds. “But our analysis of the net EROCI of oil versus renewables suggests that the balance of competitive advantage will shift decisively in favour of EVs over oil-powered cars over the next two decades.
“In turn, this would suggest that by the late 2020s or early 2030s renewables could be competing much more aggressively with the oil market’s marginal barrels for a share of Asia’s fast-growing road-transportation market (and especially China’s) than either the IEA or the oil industry itself is currently assuming.”


