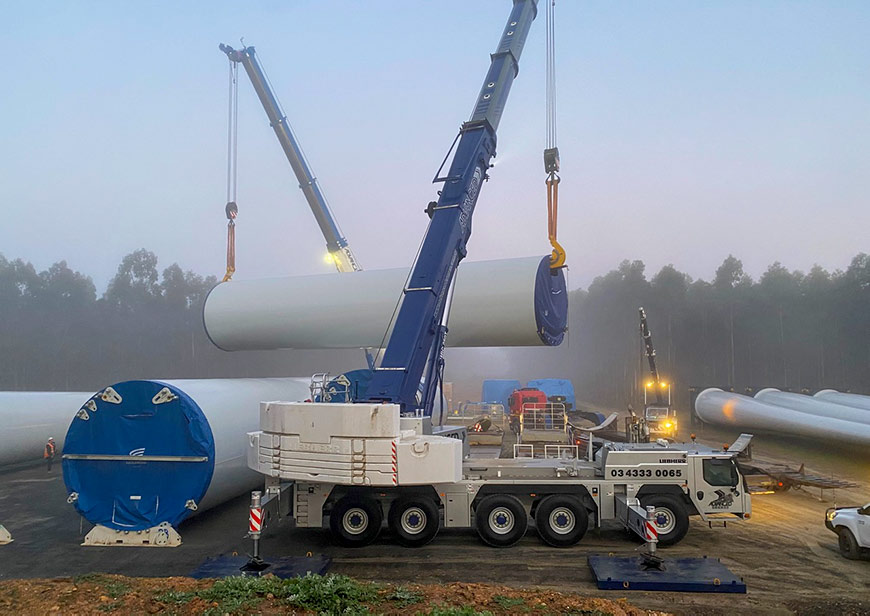
Vestas is the world’s largest non-Chinese wind turbine supplier. Incredibly, Australia represents the biggest share of its forward order book.
Think about that. Despite Joe Biden’s Inflation Reduction Act, despite not many projects getting to FID (financial close) in Australia, we are the largest share of the world’s largest non-Chinese turbine suppliers order book.
Recently. Vestas achieved a confirmed order in Australia for the 342 MW Lotus Creek Wind farm South of Mackay in Queensland, owned by the government owned CS Energy. The project cost is stated at $1.3 billion.
- Goldwind is the largest Chinese wind turbine supplier and its total forward order book is double the size of Vestas. Its domestic turbine prices are more than 20 per cent cheaper than Vestas turbines. In terms of installed turbines, Australia is – by a whisker, with an installed based of 1GW – still the largest offshore base for Goldwind. Goldwind, however, doesn’t seem to have many new orders in Australia.
Given that Goldwind turbines are lower cost and, in my opinion, their costs are driven by learning rate impacts and will continue to come down, I wonder whether Australian developers shouldn’t give Chinese turbine suppliers more of a go.
It’s not like the Vestas stuff is perfect. There are other suppliers, of course; both other European companies and GE in the US. GE, though, is likely to focus mostly on its home country, and one of Australia’s biggest wind farm developers, the French-based Neoen, was not flattering in its assessment of the western turbine suppliers, and indicated it is looking at China.
See: “Not always a great quality:” Leading wind developer may switch from western to Chinese turbines
There is a potential opportunity for Australia, because I believe China has excess capacity at the moment, it’s already largely locked out of the US market and could well be locked out further post the US election.
Australia is geographically quite close to China and we have very strong trade relationships with it. Australia actually holds the upper hand with China when it comes to commodities because of iron ore, but we also export a good share of our LNG production to China. Of course, we import a bunch of stuff as well.
When interest rates were low, Australia could have done far more infrastructure investment than we actually did do. It was an opportunity missed.
Right now we can access all the wind turbines, all the solar panels, all the batteries, all the EVs we want from a willing seller. Let’s not waste the opportunity. Let’s put the foot down now while the opportunity is there and go hard.
I am not an advocate for China’s politics. You couldn’t pay me enough to live in such a restrictive political system, but as far as trade goes it seems well to Australia’s benefit to buy when the opportunity is there.
Equally, we need to get the cost of wind energy down in Australia. The landed cost of turbines is about 60% of the total cost of a wind farm. Getting that cost down 20% would represent a 12% reduction in total costs. The second biggest cost is probably the combination of grid connection and the associated typically very negative MLF. But that’s for later analysis.
Australia is expensive, it’s time to go down the cost curve
Some work I have been doing on levelised cost of energy (LCOE) estimates from various respected commentators leads me to think that wind development in Australia is relatively expensive by global standards.
The reasons for these different estimates can be hard to pin down but, by and large, the wind resource and the land payment cost in Australia (estimated at say A$60k per turbine per year) are globally competitive and there is no reason to expect the capital cost of the turbine in $US is any different in Australia to what it is in South America.
So, I expect that much of the cost difference is due to things like connection costs, planning costs and delays, and labour, concrete, road access and so on. One thing I do think makes a difference is whether to build your wind farm on flat land or on a ridge. Crane costs are likely to be a lot higher on ridges, but this is just speculation.
LCOE/Internal rate of return (IRR)/Net present value (NPV) models of a generic description are available from a range of sources.
These include the NREL Annual Technology Baseline, which provides good documentation of assumptions but which is USA based. Lazards also produces a similar USA based analysis but with less assumption discussion. IRENA produces an understandably global report
In Australia, the most well known and heavily analysed report is the CSIRO Gencost report. However, in my opinion, the CSIRO diminished the reliability of its report by trying to include system LCOE as well as asset LCOE data.
In addition, investment banks and many others produce asset and/or project-specific NPV analysis.
However, the estimates of LCOE and inputs show considerable variation. In the following table, where an organisation has provided two or more estimates of a parameter, I have taken a simple average of the high and the low. Figures presented in $US have been converted to $A at 1.43.

Vestas turbine achieved prices are up 10%

Note I have left the new project data but in fact Vestas new orders were stated in the Quarterly p10 as:
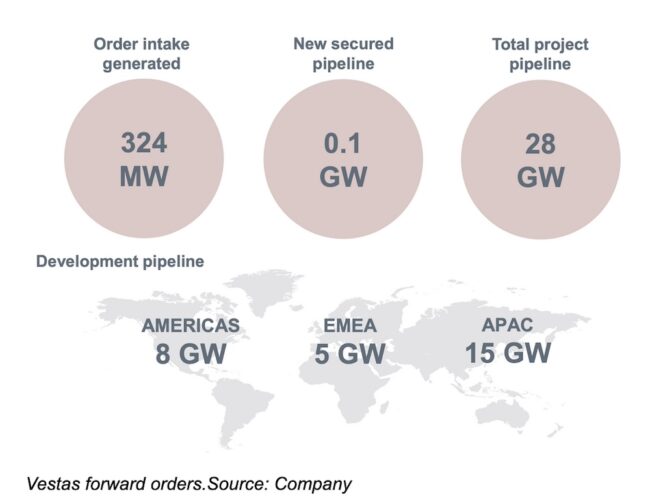
Orders exceeded deliveries in the quarter and concentrated in EMEA and Americas.
Vestas has a pipeline of 28 GW, most of which is in APAC, and Vestas states its three largest pipelines are Australia, USA and Brazil. So Australia is the biggest global market for Vestas at present. However, there wasn’t much growth in the pipeline in the quarter.
Vestas’ profitability has improved and the company has low levels of debt. Cashflow is better than last year but was negatively impacted by working capital adjustments. The company is still working out some loss-making business. Vestas states that those loss-making contracts will be completed in the current quarter.
Goldwind has double the Vestas pipeline and cheaper turbines
Unfortunately, who ever was responsible for the English-language presentation of Goldwind’s Q3 results forgot to put any currency numbers on the following figure. Still, I assume the quoted construction cost for China in 2023 is $US986/KW.
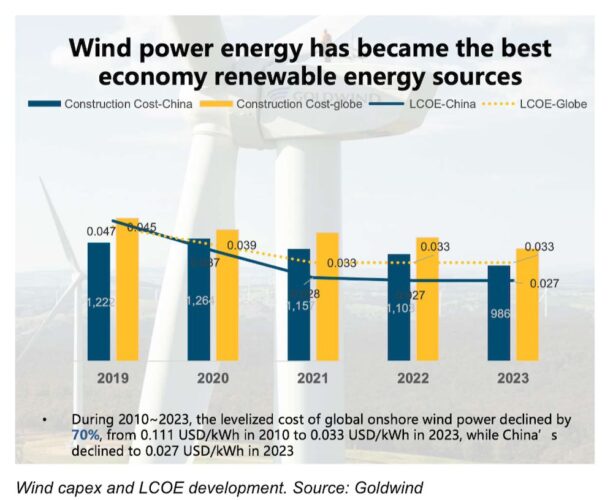
If I convert the US$ numbers to A$, it’s a construction cost in China of $A1410 (about half the cost of fully constructed and connected plant in Australia) and the LCOE is $A38/MWh. Those numbers are materially less than the NREL estimate for the USA and the IRENA global estimate. Obviously they are less than 50% of the cost of wind in Australia.
On price, Goldwind shows the bid price into China’s bidding system.
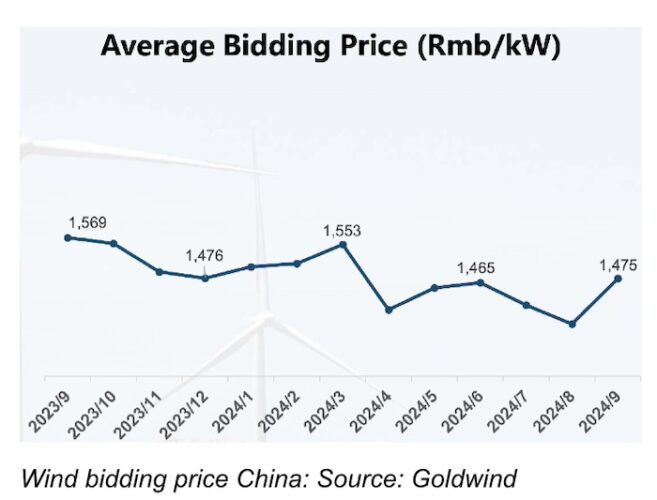
These numbers are shown in RMB per kW. For a capacity factor of 25% and 30 years of lifetime that amounts, on my arithmetic, to a subsidy of about $A5/MWh but my arithmetic is not very good. I guess the real point is it’s falling a little bit.
So assuming Goldwind’s numbers are accurate there are two implications:
– Australia will not be competitive with China in an electricity system dominated by wind.
– Australia needs to work on getting its wind costs down. I’d argue that one way to do that is to use the Chinese expertise.
Goldwind states China installed 39 GW in the first 9 months of the year, that’s 1 GW a week. Wind capacity factor was (1134/8760)*2=26% which is not all that bad. Australia could do quite a bit better if one was to ignore MLFs and curtailment.
Goldwind sold nearly 10 GW of turbines in the first 9 months of the year and about 57% of that was 6 MW or larger. Total backlog, conceptually a firmer measure than the Vestas pipeline, is 44 GW, of which 73% is 6 MW. More importantly, the firm order backlog was 29 GW. And more importantly still, 5.5 GW of new orders were ex China
Unlike Vestas, Goldwind is geared with $A11.7 billion of debt. Deeply regrettably I don’t read Chinese, but to the best of my ability I cannot find where Goldwind reports depreciation in its quarterly data.
Operating income, an American concept, close to the Australian concept of EBIT (earnings before interest and tax) was $A7.7 billion for the 9 months, let’s say $A10 billion for the year and I estimate EBITDA (earnings before interest, tax, depreciation, and amortisation) at, let’s say, $A11 billion. That’s a debt:ebitda ratio of around 1, which is reasonably ok and compares to Vestas quite closely.
Note: This article has been corrected. I confused Vestas new projects with Vestas orders (backlog). I apologise for the error. The revised text shows the new orders corrects some incorrect inference about the relative importance of Australia to Vestas.
Vestas unfulfilled orders are concentrated in EMEA and USA and certainly not Australia. Additionally since I am making the correction readers might note some feedback from the earlier version. “The Goldwind turbine is indeed cheaper and cheaper to maintain but is expensive to erect. Goldwind towers are much heavier and use more steel.”

