Emissions from coal and gas fell in 2022, due to strong growth in clean energy, above-average temperatures and record-high fossil fuel prices suppressing demand.
The 15% reduction in coal use means UK demand for the fuel is now the lowest it has been for 266 years. The last time coal demand was this low was in 1757, when George II was king.
Emissions from oil increased, as road traffic returned to pre-Covid levels and air traffic doubled from a year earlier. However, this was outweighed by the reductions from coal and gas.
UK emissions have now fallen in nine of the past 10 years, even as the economy has grown. The drop in 2022 puts UK emissions 49% below 1990 levels, while the economy has grown 75% over the same period.
Carbon Brief’s analysis, based on preliminary government energy data, shows UK emissions fell by 14m tonnes of carbon dioxide equivalent (MtCO2e) in 2022. Emissions will need to fall by a similar amount every year – for the next three decades – to reach net-zero by 2050.
The analysis also shows that emissions would have increased in 2022, if temperatures had not been 0.9C above average and without strong growth from wind and solar energy.
This means only a fraction of last year’s emissions cuts came from deliberate action. Moreover, with coal use already at such low levels, the UK will need to address emissions from buildings, transport, industry and agriculture if it is to make further progress towards its net-zero target.
Covid closure
The coronavirus pandemic triggered record reductions in greenhouse gas emissions in the UK and globally in 2020. An inevitable rebound followed, as economies reopened from lockdowns.
This rebound continued in 2022, as higher road and air traffic helped push global emissions to a new record.
In the UK, however, emissions fell by 3.4%, according to Carbon Brief’s new analysis. This drop ended the UK’s post-Covid emissions rebound, as shown in the chart below.
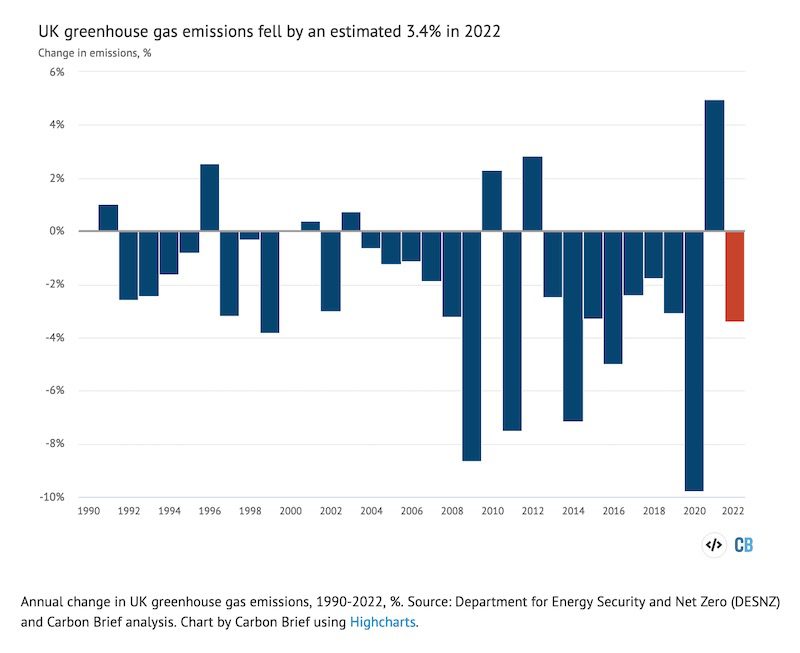
After having fallen by 9.8% in 2020 during the height of Covid, emissions had risen by 5.0% in 2021. Emissions in 2022, at an estimated 412MtCO2e, were slightly higher than in 2020 (406MtCO2e), which remains the lowest in the modern era.
Greenhouse gas emissions within UK borders have now fallen in nine of the past 10 years. Indeed, UK emissions have only risen year-on-year seven times since 1990.
In 2022, rising UK demand for transport fuel was more than offset by declines in coal and gas.
Classical coal
The UK’s coal demand fell by another 15% in 2022 to just 6.2m tonnes. This is the lowest level since 1757, according to Carbon Brief analysis of historical data.
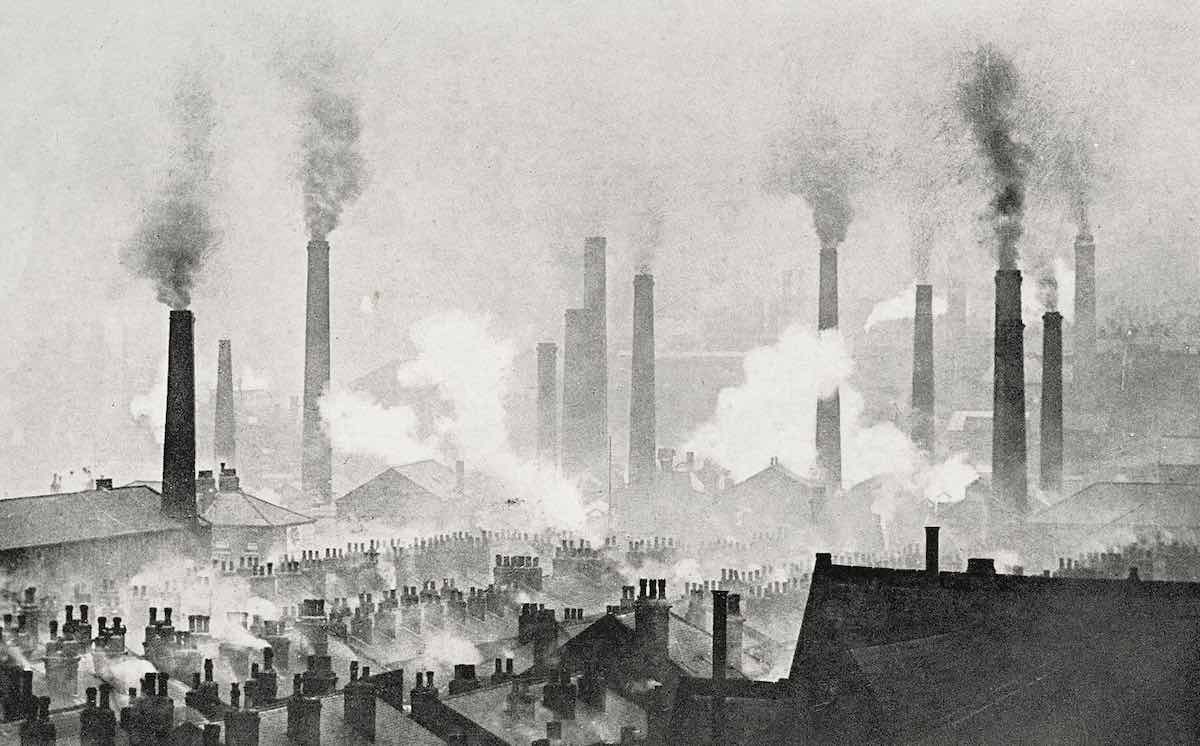
That year in the UK, George II was king, William Cavendish was prime minister and the industrial revolution had not yet begun. A year earlier, Wolfgang Amadeus Mozart had been born in Austria.
In the years that followed, UK coal use climbed rapidly as industrialisation took off. Annual demand for the fuel rocketed to 60Mt by 1850 and peaked at 221Mt in 1956.
This is shown in the chart below, which combines data covering 1853 onwards from the UK government with estimates for earlier years published by historian Paul Warde.
(The UK’s historical coal use is the main reason it remains the eighth-largest contributor to current warming. Its contribution is particularly notable given its modest population.)
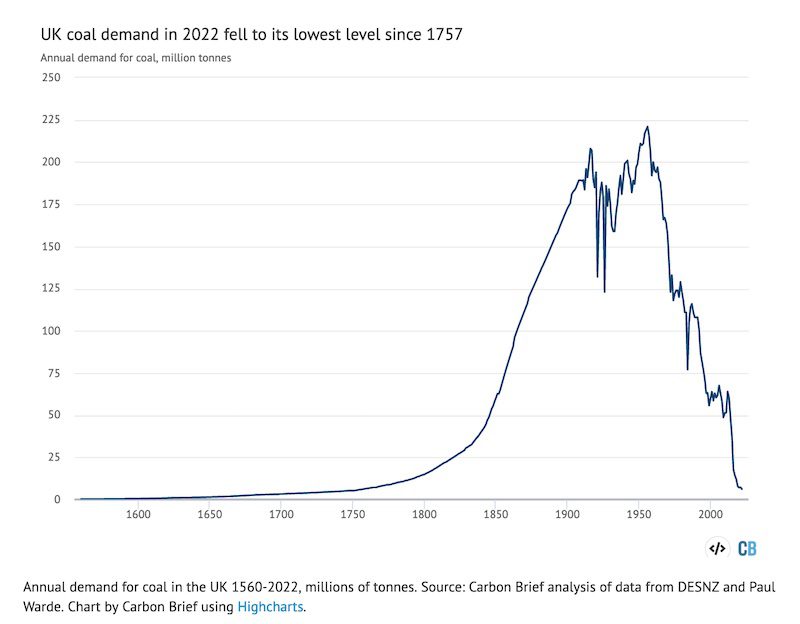
Coal’s decline in the UK has been even more precipitous than its ascent. It peaked in 1956, when the Clean Air Act was passed in response to London’s “Great Smog”. Coal use halved to around 120Mt by the 1970s and then halved again to around 60Mt at the turn of the century.
After remaining at a similar level until 2012, UK coal use has now fallen 90% in the past decade. This is mostly due to the near-phaseout of coal power, which is down 96% over the same period.
Last year, there had been fears of a coal “comeback” or a “return to coal” in the face of the global energy crisis. In the event, use of the fuel to generate electricity fell by 15% in 2022.
Electricity system operator National Grid had paid an estimated £386m to keep old coal plants open and stocked with coal, in case electricity supplies were tight. But the plants never ran.
There are several reasons why there was no need for a return to coal power in 2022.
First, UK electricity use fell by 3.8% in 2022 to its lowest level in around 40 years.
This reduction was largely due to a 9.6% drop in demand from homes. People spent more time away from home as Covid restrictions ended, with shops and offices seeing a corresponding increase in electricity use. Meanwhile, warmer temperatures reduced the need for heat, including from electricity. And historically high energy bills dampened demand.
Second, wind power climbed to a new record high in 2022, rising 25% thanks to increased capacity and a rebound from decade-low windspeeds in 2021. There were also smaller increases in generation from hydro, solar, nuclear and gas.
The combination of lower demand and higher supply from other fuels enabled the UK to become a net electricity exporter for the first time since 1978, at the same time as cutting coal power.
In addition to coal power, there have also been significant declines in coal use by the UK steel industry. Demand for coking coal to run blast furnaces fell 19% in 2022, as UK steel production fell by 16% to its lowest level since 1932, according to the International Steel Statistics Bureau.
(In 2022, the UK government approved the country’s first new coking coal mine for 30 years in Cumbria, northwest England. The vast majority of its output will be exported.)
Global steel production also fell in 2022, but only by 4%, according to the World Steel Association (WSA). UK output fell faster than many other European countries, the WSA figures show. It faced “subdued” demand, particularly from UK carmakers, as well as higher exposure to record gas prices, due to the UK’s reliance on the fuel to make electricity.
Traffic returns
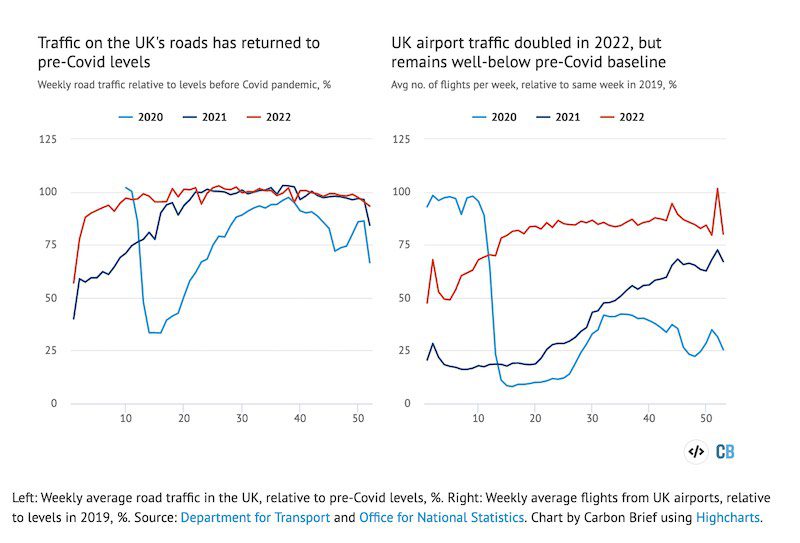
Energy use from oil in the UK grew in 2022, but remains below pre-pandemic levels. Petrol was up 8% and diesel 7%, as road traffic returned to pre-Covid levels, shown in the figure below left.
(Within this total, car traffic remains 7% below pre-pandemic levels. Movements of vans and trucks now exceed pre-Covid levels by 12% and 4%, respectively.)
Despite having doubled year-on-year in 2022, UK air traffic remains 20% below 2019 levels, shown in the chart below right. (Flight volumes remain somewhat depressed globally.)
Demand for oil products would likely have been even stronger if not for the effects of the global energy crisis, which pushed pump prices to record highs in 2022.
Note that demand for diesel remains 2% below 2019 levels, whereas van traffic is up 12% and for trucks by 4%. This discrepancy could reflect a shift in the fleet towards more fuel-efficient vehicles, including EVs, but more data will be needed to untangle it.
Similarly, petrol demand is 6% lower than in 2019 while car traffic is 7% pre-pandemic levels. On the face of it, these figures are consistent, but within these totals the car fleet is shifting away from diesel towards petrol, hybrids and EVs, as well as towards SUVs.
Warm winds
UK demand for gas, which fell by 9%, was also depressed by high prices. Gas prices reached unprecedented highs after Russia invaded Ukraine and severely cut supplies to Europe.
However, this was not the only factor behind falling gas demand.
The UK experienced 40C heat for the first time in the summer of 2022 and above-average temperatures affected much of the year. Overall, the year was 0.9C warmer than the UK average for 1991-2020.
The unusually mild weather in 2022 reduced demand for building heat and cut the use of gas. Without these above-average temperatures, gas demand would have been higher and UK greenhouse gas emissions would only have dropped by around 7MtCO2e, instead of 14MtCO2e.
Without increases in output from wind (+25%) and solar (10%), more fossil fuels would have been needed to generate electricity. If coal and gas had each covered half of this gap, then UK emissions would have been around 11MtCO2e higher.
This means that UK emissions would have risen in 2022 without strong growth from renewables and above-average temperatures, as shown in the figure below.

This analysis highlights the fragility of UK emissions reductions in 2022, only parts of which were due to deliberate climate action. The UK cannot hope to achieve its targets on the back of cyclical swings in temperature and weak demand caused by a once-in-a-generation global energy crisis.
Decoupling emissions
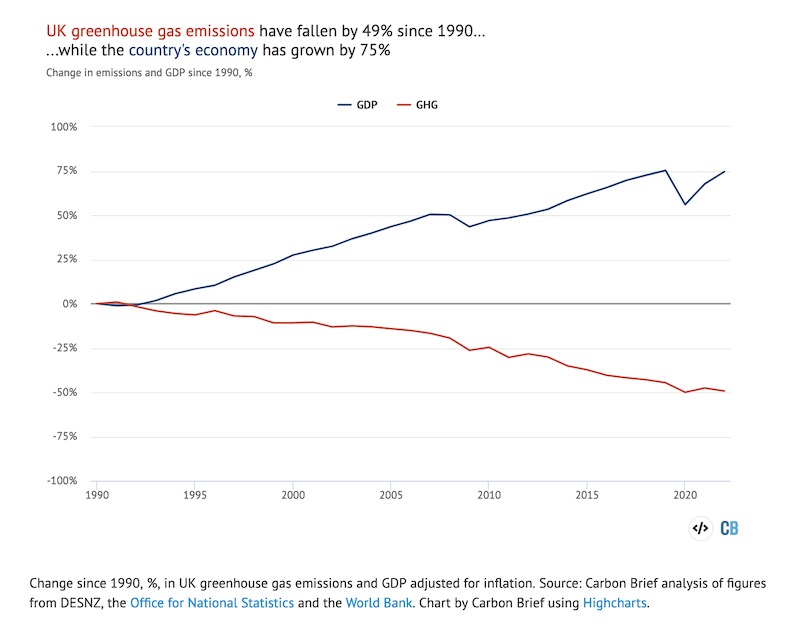
The drop in emissions in 2022 came despite economic growth of 4.1%. The UK’s emissions are now 49% below 1990 levels, while the economy has grown 75% over the same period.
This means the UK is “decoupling” economic growth from emissions, shown in the chart below. (This article is based on territorial emissions within the UK. However, emissions linked to UK consumption of domestic and imported goods are also in long-term decline.)
The UK is facing a recession in 2023 and weak growth thereafter, according to the independent Office for Budget Responsibility (OBR). This points towards further emissions cuts, if recent trends in the “emissions intensity” (emissions per unit of GDP) of the economy continue.
Other factors likely to support emissions cuts in 2023 include expanding renewable capacity and a return to net electricity imports, meaning the UK will need to generate less power. Net imports to the UK are likely, because clean electricity output will rise in continental Europe this year, as wind and solar capacity grows, while hydro and nuclear bounce back from unusually low levels.
On the other hand, UK temperatures may be closer to average in 2023, which would drive up demand for gas and electricity. There is also clear potential for car and flight traffic to continue climbing back towards pre-pandemic levels and beyond, particularly as oil prices moderate.
Net-zero target
The UK has made rapid progress in cutting its greenhouse gas emissions over the past decade and 2022 continued that trajectory. However, most recent progress has come in the power sector, where coal has been nearly phased out.
UK emissions fell by 14MtCO2e in 2022, according to Carbon Brief’s analysis. Yet similar cuts will be needed every year, for the next three decades, in order to reach net-zero by 2050. This trajectory is shown in the figure below.

In order to continue cutting emissions, the UK will need to look beyond coal power for savings. This will mean cutting gas-fired generation, even as the economy is electrified and demand rises.
It will mean rapidly building out wind and solar capacity, while ensuring there are sufficient sources of flexible low-carbon supply to meet demand, when it is not windy or sunny.
Meanwhile, the UK will need to replace the low-carbon electricity it currently sources from ageing nuclear reactors, almost all of which are due to close by 2030. Moreover, emissions in other parts of the economy will need to be tackled, including those from the gas boilers that keep buildings warm and the combustion engines that fuel the country’s transport system.
Finally, the UK will need to tackle the hardest-to-abate sectors such as industry, aviation and agriculture, where some emissions may be impossible to eliminate. This could necessitate CO2 removals to balance the UK’s emissions budget and ensure it reaches net-zero.
The government’s advisory Climate Change Committee (CCC) has repeatedly warned that the UK is not on track to meet its goals.
Government ministers have reportedly been warned of potential legal action over their failure to put sufficient policies in place. A particular focus is the Department for Environment, Food and Rural Affairs (DEFRA), the Observer reports, because it does not have a net-zero strategy.
The government’s overarching net-zero strategy has been ruled unlawful because it omitted key details on where emissions cuts would be made. A new version is due by the end of the month.
Methodology
The starting point for Carbon Brief’s analysis of UK greenhouse gas emissions is preliminary government estimates of energy use by fuel. These are published quarterly, with the final quarter of each year appearing in figures published at the end of the following February. The same approach has accurately estimated year-to-year changes in emissions in previous years (see table, below).
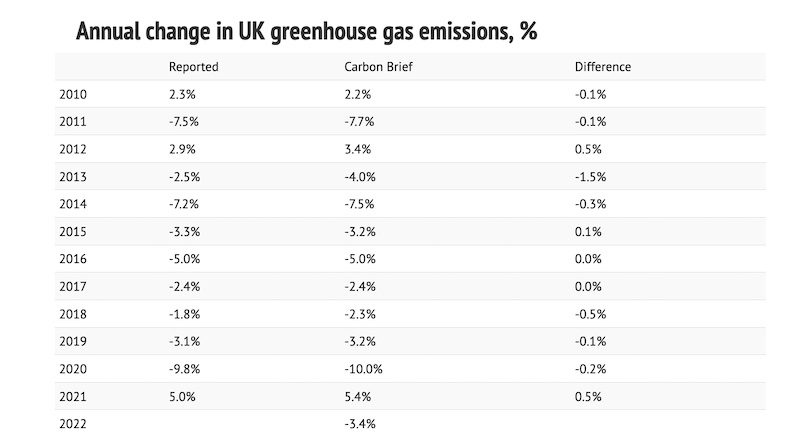
One large source of uncertainty is the provisional energy use data, which is revised at the end of March each year and often again later on. Emissions data is also subject to revision in light of improvements in data collection and the methodology used.
The table above applies Carbon Brief’s emissions calculations to the latest energy use and emissions figures, which may differ from those published previously.
Another source of uncertainty is the fact that Carbon Brief’s approach to estimating the annual change in emissions differs from the methodology used for the government’s own provisional estimates. The government has access to more granular data not available for public use.
Carbon Brief’s analysis takes figures on the amount of energy sourced from coal, oil and gas reported in Energy Trends 1.2. These figures are combined with conversion factors for the CO2 emissions per unit of energy, published annually by the UK government. Conversion factors are available for each fuel type, for example, petrol, diesel, gas, coal for electricity generation.
For oil, the analysis also draws on Energy Trends 3.13, which further breaks down demand according to the subtype of oil, for example, petrol, jet fuel and so on. Similarly, for coal, the analysis draws on Energy Trends 2.6, which breaks down solid fuel use by subtype.
Emissions from each fuel are then estimated from the energy use multiplied by the conversion factor, weighted by the relative proportions for each fuel subtype.
For example, the UK uses roughly 50m tonnes of oil equivalent (Mtoe) in the form of oil products, around half of which is from road diesel. So half the total energy use from oil is combined with the conversion factor for road diesel, another one-fifth for petrol and so on.
Energy use from each fossil fuel subtype is mapped onto the appropriate emissions conversion factor. In some cases, there is no direct read-across, in which case the nearest appropriate substitute is used. For example, energy use listed as “bitumen” is mapped to “processed fuel oils – residual oil”. Similarly, solid fuel used by “other conversion industries” is mapped to “petroleum coke”, and “other” solid fuel use is mapped to “coal (domestic)”.
The energy use figures are calculated on an inland consumption basis, meaning they include bunkers consumed in the UK for international transport by air and sea. In contrast, national emissions inventories exclude international aviation and shipping.
The analysis, therefore, estimates and removes the part of oil use that is due to the UK’s share of international aviation. It draws on the UK’s final greenhouse gas emissions inventory, which breaks emissions down by sector and reports the total for domestic aviation.
This domestic emissions figure is compared with the estimated emissions due to jet fuel use overall, based on the appropriate conversion factor. The analysis assumes that domestic aviation’s share of emissions is equivalent to its share of jet fuel energy use.
In addition to estimating CO2 emissions from fossil fuel use, Carbon Brief assumes that CO2 emissions from non-fuel sources, such as land-use change and forestry, are the same as a year earlier. Remaining greenhouse gas emissions are assumed to change in line with the latest government energy and emissions projections.
These assumptions are based on the UK government’s own methodology for preliminary greenhouse gas emissions estimates, published in 2019.
Note that the figures in this article are for emissions within the UK measured according to international guidelines. This means they exclude emissions associated with imported goods, including imported biomass, as well as the UK’s share of international aviation and shipping.
The Office for National Statistics (ONS) has published detailed comparisons between various different approaches to calculating UK emissions, on a territorial, consumption, environmental accounts or international accounting basis.
The UK’s consumption-based CO2 emissions increased between 1990 and 2007. Since then, however, they have fallen by a similar number of tonnes as emissions within the UK.
Bioenergy is a significant source of renewable energy in the UK and its climate benefits are disputed. Contrary to public perception, however, only around one quarter of bioenergy is imported.
International aviation is considered part of the UK’s carbon budgets and faces the prospect of tighter limits on its CO2 emissions. The international shipping sector has a target to at least halve its emissions by 2050, relative to 2008 levels.
This article was originally published by Carbon Brief. Reproduced here with permission. Read the original version here.