The influence of manmade global warming on the climate system continues to grow, with human fingerprints identified in more than two dozen climate “indicators” examined by an international research team — from air temperatures to ocean acidity — for a comprehensive annual “State of the Climate” report released Tuesday.
In a related study also released on Tuesday, climate researchers said manmade global warming is already shifting the probability of many extreme weather and climate events, making heat waves, droughts, and other events more likely to occur in some parts of the world.
Together, the two reports amount to a comprehensive accounting of the present state of the climate system, over which mankind is now exerting a greater impact than ever before.
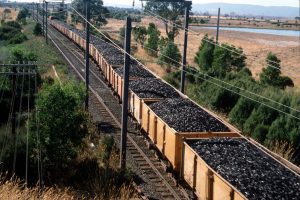
The “State of the Climate 2011” report, published by the National Oceanic and Atmospheric Administration (NOAA) and the American Meteorological Society (AMS), presents a peer reviewed tour through the weather and climate events of 2011. The overriding theme that emerges from the report is that the effects of human activities are readily evident, be it in the form of rising concentrations of greenhouse gases in the atmosphere — global carbon dioxide concentrations hit a new all-time high of 390 parts per million last year, and will cross the 400 ppm threshold worldwide by 2016 — to the inexorable increase in ocean heat content.
The report shows that a La Nina event, characterized by cooler-than-average sea surface temperatures, helped keep global average surface temperatures down compared to 2010, but it was one of the warmest La Nina years on record.
In the Arctic, which has been warming at twice the rate of the rest of the globe, 2011 had the second-lowest sea ice extent on record. Barrow, Alaska, located above the Arctic Circle, experienced a record 86 straight days when the temperature failed to drop below freezing.
The report also contains evidence from ocean salinity measurements that the global water cycle is intensifying. “The dry regions are getting drier and the wet regions are getting wetter,” Kate Willet, a senior scientist at the U.K. Met Office said on a conference call with reporters.
The other climate assessment, which was also released by NOAA and the AMS, represents a step forward in efforts to decipher how manmade global warming is influencing specific extreme weather and climate events.
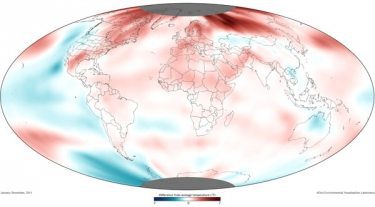
 Global average surface temperature departures from average during 2011. Credit: NOAA.
“Every weather event that happens now takes place in the context of a changing global environment,” said deputy NOAA administrator Kathryn D. Sullivan in a press release.
Researchers used different approaches to analyze a half-dozen extreme weather and climate events that occurred last year, from the brutal Texas drought and heat wave to the deadly Thailand floods.
The report notes that global warming has already been playing a role in shifting the odds for several of these extreme events, including the Texas drought. The 2011 growing season was by far the warmest and driest in Texas history, and the drought was the worst one-year drought on record there as well, costing billions in agricultural losses.
The study concluded that, due to manmade global warming, La Nina-related heat waves are now 20 times more likely to occur in Texas than they were 50 years ago.
Weather patterns during La Nina years naturally tend to favor warmer and drier conditions in the Lone Star State. According to Peter Stott, who leads the Climate Monitoring and Attribution team at the U.K.’s Met Office, since manmade global warming is boosting average temperatures, it makes it more likely that certain thresholds will be reached or exceeded when a La Nina occurs. “You’re [now] much more likely to have exceptional warmth,” in Texas during a La Nina year, he said.
Other researchers looked at international events and came to different conclusions depending on the questions researchers asked and the specific event in question. For example, scientists looked into the shifting odds for two unusual months that the U.K. experienced in 2010 and 2011. The U.K. had a very warm November of 2011, and rare cold during December 2010, during which time much of Britain experienced a white Christmas.
The study found that, because of manmade global warming and other factors, cold Decembers are now half as likely to occur as they were 50 years ago, and warm Novembers are 62 times more likely to take place.
Other experts in the burgeoning field of “extreme-event attribution” took on the challenge of determining whether there was a global warming influence on the record Thailand floods of last year.
The floods were the worst to occur there since 1942, with some areas remaining submerged by 6 feet of water for more than two months, according to NOAA. The floodwaters damaged or destroyed many high tech manufacturing centers, leading to delays in shipping equipment such as laptop computers.
In this case, the researchers found evidence that the floods were manmade, but not because of climate change. The study concluded that the rainfall amounts were not actually unprecedented or that unusual for Thailand, and that industrial development, reservoir management policies, and other trends on the ground contributed to the flooding.
“The flooding was unprecedented but the rainfall that produced it was not,” Stott said.
Stott is working with an international team of scientists to advance extreme-event assessments, and has raised the possibility of eventually being able to conduct them in near-real time if the science advances far enough.
(This section was first published in Climate Central. Reproduced with permission).
Australian scientists respond
The NOAA report involved 11 Australian scientists. Australia is covered in Chapter 7 dealing with regional climates. NOAA has also created a resource page with images, highlights and explainers etc.
Below several Australian scientists, including one of the report’s authors, comment on the report. The quotes were collated by the Australian Science Media.
Dr Karl Braganza is the Manager of Climate Monitoring at the National Climate Centre, Bureau of Meteorology
“While many have focussed on the extreme events detailed in the BAMS 2011 State of the Climate, the report also details continued long-term changes in climate.
“Most notably, the Arctic continues to warm at a very rapid rate – around twice the rate of warming compared with the rest of the planet – continuing a now well-established trend. The warming of the Arctic and the loss of Arctic sea-ice is one of the key positive feedback mechanisms involved in amplifying greenhouse-forced climate change. Arctic sea-ice extent was the second lowest on record at the end of the 2011 summer, and is tracking at lowest on record for 2012. In addition, the ocean heat content (OHC), a measure of heat stored in the oceans, was also in record territory during 2011, and continues another well-established long-term warming trend.
“Global atmospheric carbon dioxide concentrations topped 390 parts per million for the first time in the instrumental record, with individual readings from monitoring stations in 2012 topping 400 parts per million. These are very likely the highest concentrations of atmospheric carbon dioxide in the last 100,000 years, and perhaps the last several million years. Atmospheric carbon dioxide levels are now similar to those during the Pliocene, a much warmer period than any experienced by modern humans.
“These indicators show that climate change, especially changes to atmospheric chemistry, are not just continuing but tracking at the more extreme end of possible scenarios.
“It is against this backdrop that the increasing frequency of extreme weather events observed in the last decade should be gauged. Increasing greenhouse gases have warmed the entire climate system, such that all weather now occurs in a climate almost one degree warmer than a century ago. This warming will continue to load the dice in favour of extreme warm weather and climate events. Events experienced in recent times are therefore an important heuristic for future climate change impacts.”
Dr Rob Massom is with the Australian Antarctic Division and the Antarctic Climate and Ecosystems Cooperative Research Centre and was one of the Australian authors of the report with his specific focus being Antarctica and sea ice
“This annual report is of crucial importance in that it allows us to keep close tabs on the changing state and behaviour of the global climate system. The report now tracks 43 global-scale climate indicators, with a view to better understanding climate change and its complex causes and effects; one of these indicators is Antarctic sea ice.
“Every year, up to 19 million square kilometres of the surface area of the Southern Ocean surrounding Antarctica freezes, and the resultant sea ice cover plays a key role in the global climate system. Not only this, but the sea ice is also a sensitive indicator and modulator of change and variability in patterns of atmospheric and oceanic circulation and temperature, the effects of which are amplified at high latitudes. Moreover, close linkages exist between processes occurring in Antarctica and the Southern Ocean and Australian weather and climate.
“In 2011, Antarctic sea ice areal extent exhibited considerable variability about the long-term (30-year) mean, depending on season. Whereas the ice extent attained a record low in April, it was well above average in December. The latter reflects the prevalence at that time of low pressure systems and generally cool conditions around the Antarctic perimeter.”
Professor David Karoly is a climate scientist from the School of Earth Sciences at the University of Melbourne
“This report on global and regional climate variations in 2011 is comprehensive and BIG!!
“It provides detailed evidence of continuing climate change, including record-high global concentrations of carbon dioxide and ongoing warming of the upper layers of the ocean. Many of the regional variations of climate in 2011, including in Australia, were dominated by the effects of La Nina. In Australia, this led to record-high two year totals of rainfall, many areas in eastern and northern Australia experiencing flooding, lower than recent average temperatures, but very dry and hot conditions in the southwest of WA.”
Associate Professor Paul Beggs is Deputy Head of the Department of Environment and Geography at Macquarie University. His area of research is focussed on the impacts of climate change on human health
“This comprehensive and impressive “State of the Climate in 2011” report by the internationally respected American Meteorological Society and US National Oceanic and Atmospheric Administration, while a snapshot of climate last year, also places this into accurate historical perspective and provides information on the state, trends, and variability of the climate system.
“Australia’s climate in 2011 features prominently in the report, with our wettest two-year period (2010–11) on record being highlighted in the first paragraph of the report, a dramatic picture of the associated flooding of Rockhampton in January 2011 comprising the report’s back cover, and much in between. The report provides yet another international expert assessment showing our global climate changing.
“While beyond the scope of this particular report, the adverse impacts of this changing climate are also clear and undeniable, and are with us already. The Australian Government’s action on climate change through its introduction of the carbon tax is to be applauded and embraced by Australians. Such efforts will reduce the extent of, but not stop, future climate change. Therefore, Australia and the rest of the world must also now adapt to climate change, with again the efforts of Australia’s National Climate Change Adaptation Research Facility vital both now and into the future.”