Time to put energy retailers and their offers under the microscope

This year, the retail part of the electricity sector will be getting lots of official attention.

Professor Alan Finkel’s review is understood to be interested in retail. In Victoria, Professor John Thwaites and Mr Terry Mulder will review this part of the industry. Nationally, the AEMC will be producing their study of the competitiveness of the retail sector, under the supervision of new Senior Director.

It is appropriate to scrutinise this part of the electricity sector: many, perhaps most, small customers in Australia seem to be charged more for electricity to be sold to them, than they are for electricity to produced. This is weird and explains in part why electricity prices in Australia compare so poorly with those in other countries.

But it is difficult to work out what retailers are actually charging for their services, compared to the other parts of an electricity bill (network charges, wholesale charges and environmental charges). For example:

  • Network charges are visible through published tariffs (for larger customers, network charges are itemised on their bills).
  • Wholesale charges can be reasonably estimated based on spot and contract market data.
  • State and federal environmental charges can be reliably estimated.

But retailers’ charges are not itemised on customers bills. The retail charge has to be derived by backing out the network, wholesale and environmental parts of the customer’s total bill.  And customers do not pay the same price.

There are currently 31 retailers that together make more than 8,000 different offers to the circa 8.3 million connections in the deregulated small customer markets in New South Wales, Victoria, South Australia and South East Queensland. Many of these retailers change their offers quite often during the year.

Since April last year MarkIntell has been keeping track of all retail offers through software that automatically collects all the electricity price fact sheets of these retailers (from their websites) and then mines the fact sheets for the data they provide on prices, solar charges, exit fees and incentives.

So, now it is possible to see much more clearly what is going on in the retail market for different types of customers on different retail offers.

In the interest of a more transparent market (competition thrives in the sunshine) we developed the MarkIntell Residential Indices (MRI) to show how electricity bills and the break down of those bills into their components are change over time.

MRI contrasts prices and retailer charges on the Standing Offers of the three biggest retailers in each state, the cheapest Market Offers of these three biggest retailers and the average of the two cheapest offers from all retailers in each state.

In the development of these indices we have been guided by the best practices elsewhere. In Britain, the energy regulator has published similar indices for the British market, for the last four years. Similar excellent retail market monitoring can be seen in the publications of the Council of European Regulators.

Indices – in any market – are generalisations. A good index provides a useful feeling for a market and, as long as its calculation is consistent, provides a reliable picture of changes over time.

For MRI we assume a 4,800 kWh per year customer – a typical household customer. And we assume the customer does not have controlled load, solar panels or batteries. In due course we may publish indices that also cover these market segments.

MRI will be available through Reneweconomy. You can find it here.

The package of eight indices for the period to the end of January 2017 can be found here and will be updated each month in the first week of the month. The Residential Annual Bill Index (for South Australia, below) shows that bills on Standing Offers jumped up in July last year  and, as expected have stayed about the same since, increasing again at the end of last year.

The average of the big three retailers’ cheapest Market Offers also jumped up in July and since then have stayed about constant. But perhaps the most notable feature in the index is that the cheapest offers from all retailers have been increasing since July and are now much the same as the cheapest offers from the big three.

Picture1

It is widely advertised by government officials, some customer groups and retailers that you can get better deals by shopping around. But the index for January in South Australia is now showing only a small gap between the cheapest offers from the Big Three retailers and the cheapest offers in the market.

Big Three retailers might be looking at the new entrant retailers’ offers and feeling pretty comfortable right now: where is the competitive threat (on prices at least). Some equity analysts have made similar comments in their assessment of the valuation of these retailers. I wonder what consumers, solar and battery vendors, and of course policy makers think of this?

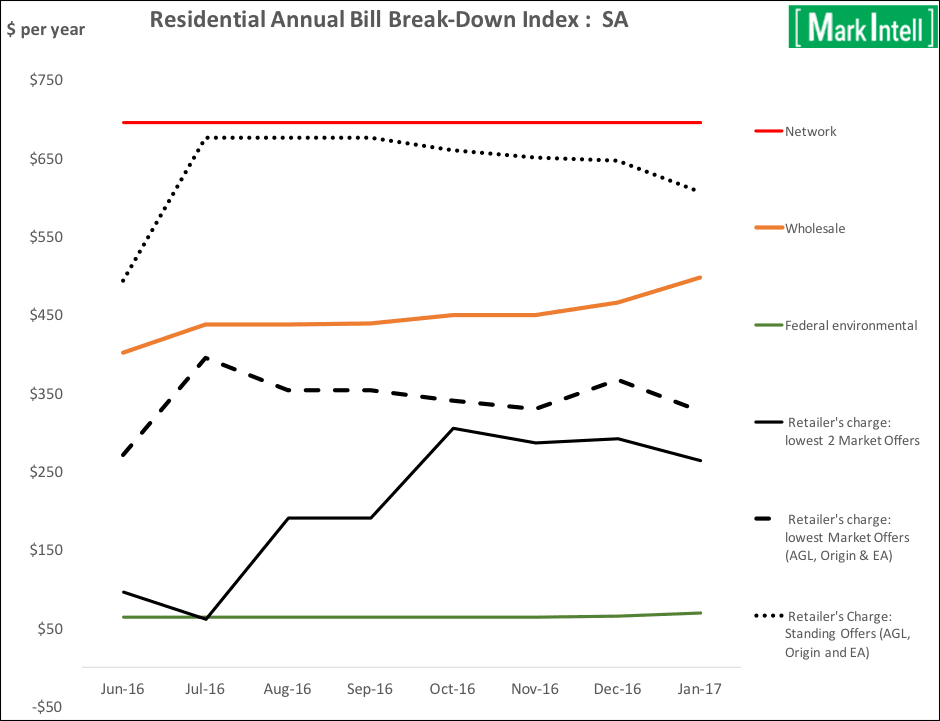
Stepping into the analysis of bills, the Residential Bill Break-Down Index takes the retail bill and strips into retailer, wholesale, network and environmental charges. It shows the annual charges for network, environmental and wholesale charges and then shows the retailer’s charge:

  • firstly assuming retails bills are based on the average of the Big Three retailers’ Standing Offers;
  • secondly retail bills are based on the average of the Big Three’s cheapest Market Offers; and
  • thirdly retail bills are based on the average of the two cheapest market offers from all retailers.

Picture1

Many more things can be seen in this and the other indices. Maybe they can help those concerned with outcomes for consumers to direct their attention to the right issues.


Bruce Mountain is the Director of Carbon and Energy Markets and co-founder of MarkIntell.

Comments

9 responses to “Time to put energy retailers and their offers under the microscope”

  1. David Pethick Avatar

    Hi Bruce – congratulations on the launch of MarKIntell. The index approach seems a sensible way to deal with the uncertainty of some of the costs borne by retailers (e.g. load shape, credit risk etc.).

    I’d be interested to see a slightly different cut of the data – for each State, the dominant gentailer’s lowest offer (i1) vs the median “non-gentailer” offer (i2). The first index is a proxy for the “save” offer that a customer will receive when they try to switch retailer. The second index is a proxy for the lowest price a Tier 2 retailer could offer and still make money.

    In a competitive market, i2 i1.

    The definitions of the indices probably need some work, but it would be interesting to see some version of this that focuses on the battlefield – tier 2 and tier 3 retailers trying to take customers away from large gen-tailers.

    Cheers.

    Dave P.

    1. bruce mountain Avatar
      bruce mountain

      Hi Dave. Thanks, excellent comments. I agree this would be useful. But my aim here is less about strategic analysis of retailers – there is a really important place for that – than to provide market watchers a starting point in seeing the best (and worst) that the market is offering

  2. David leitch Avatar
    David leitch

    Personally I no longer believe retailing is all that profitable. In South Australia and increasingly in other states independent retailers will have trouble sourcing energy. Most small retailers underestimate long term IT and bad debt costs. Even the big three don’t show that good a return on capital. Per capital consumption isn’t growing and switching costs are low. You could interpret the data as showing competition works.

    1. bruce mountain Avatar
      bruce mountain

      Hi David. One can not conclude from this about retailer profitability. The retailer charge does not distinguish how much their charge is profit and how much cost. To get that we need to get to the next level down. But I don’t agree that we can conclude from this that the market is working. To the contrary, the question that this raises in my mind is why retailing accounts for so much of the customers’ bill. It is the least capital intensive bit of the value chain by far and transction costs are surely not large. So why is it so expensive. I suspect the answer may lie in customer acquisition costs which then begs the question of why these are so high. Specifically, why are customers so sticky and what does this mean for the competitiveness of the market the distribution of gains between incumbent and new entrant retailers.

  3. Hugo Armstrong Avatar
    Hugo Armstrong

    A valuable insight.
    This analysis seems to provide yet more evidence that Victorians are being dudded by the tier one retailers, who trouser the proceeds of lower network charges and effectively use it to subsidise their customers in other states (or their shareholders).
    Several reports in recent years by Oakley Greenwood for Victorian DBs demonstrated the same thing, so it has been going on for some time.
    Let’s hope John “Scully” Thwaites and Terry Mulder can nail these practices for the sake of Victorian consumers.

  4. CaresAboutHealth Avatar
    CaresAboutHealth

    MarkIntell has been keeping track of all retail offers through software that automatically collects all the electricity price fact sheets of these retailers (from their websites) and then mines the fact sheets for the data they provide on prices, solar charges, exit fees and incentives.
    Any chance of writing a simple interface so that the average electricity user could use it to determine the best available offer for their circumstances? This is what energymadeeasy.gov.au should be doing, but they have made such a mess of it (no solar, not able to distinguish between controlled loads 1 & 2) that it needs a real system such as MarkIntell to shame them into doing a half decent job!
    You could always ask for donations from consumers who save a lot of money by using your information!

    1. bruce mountain Avatar
      bruce mountain

      Hi CaresAboutHealth. Wow this is really perceptive comment. Amazing that someone evidently outside the industry can have this level of detailed knowledge. I agree with the concerns you raise. Our approach at this stage is not to, ourselves, to take MarkIntell directly to customers. I’m afraid it has taken a herculean effort to get this off the ground and a software development team in France and Ireland to make it happen. I will use the insights form MarkIntell to write and research and put as much as I reasonably can in the public domain, but I’m afraid we can not afford to make this available as you suggest, not yet at least..

      1. CaresAboutHealth Avatar
        CaresAboutHealth

        Thanks for your insights, Bruce. Other people might be interested to know that all the info on all the retailers’ electricity plans can be downloaded from the energymadeeasy.gov.au website. The format is a bit messy, but it wouldn’t take much to convert it into something that would do a pretty good job of identifying the best offers, based on current consumption, solar generation and other requirements.

        Given the complexity of current market offers, and the large numbers of consumers who could benefit, it would make an ideal public service project.

        1. bruce mountain Avatar
          bruce mountain

          I’m afraid scraping the AER’s site is helpful but on its own does not get you there. In this area near enough is not good enough, if you are to provide high quality proper analysis of the whole market that keeps up with changes.

Get up to 3 quotes from pre-vetted solar (and battery) installers.