“O, wind, if winter comes, can spring be far behind?”
Percy Bysshe Shelley
One spring does not make a year, let alone a decade, but spring clearly shows that more low variable cost supply will lower prices.
Or as my ex boss might have said: “Thanks for that value add Warren Buffet”. Nevertheless, it does restore confidence after very unusually poor wind output in winter to see prices falling.
It’s only the second day of Spring in 2024 and until the next coal generators close (Yallourn in 2028) likely to be followed soon after by Eraring and Gladstone, until then new supply will drive down average prices.
Still, this brings new issues about how to manage curtailment, and how to integrate behind the meter resources.
I also have a question in my mind as to whether the low wind output had a structural element. Was low wind output in winter caused by warmer oceans in Winter? If so we likely can expect more of the same? I am not the person to answer that question, but it’s interesting.
In spring the output of VRE (wind and solar) energy goes up and demand is lower because it’s too early for much air conditioning and too warm for heating.
VRE goes up because winds in spring are strong and solar output goes up seasonally. The burst from wind doesn’t last all that long but the solar output increases strongly right up to Xmas.
These patterns of generation should be second nature to anyone that watches production every year for the past 15 years like me.
However, I show below a couple of charts updated on my website every week. These first two show 30 day averages so still showing a little of winter. The impact of the low wind this winter is shown particularly in the second chart.
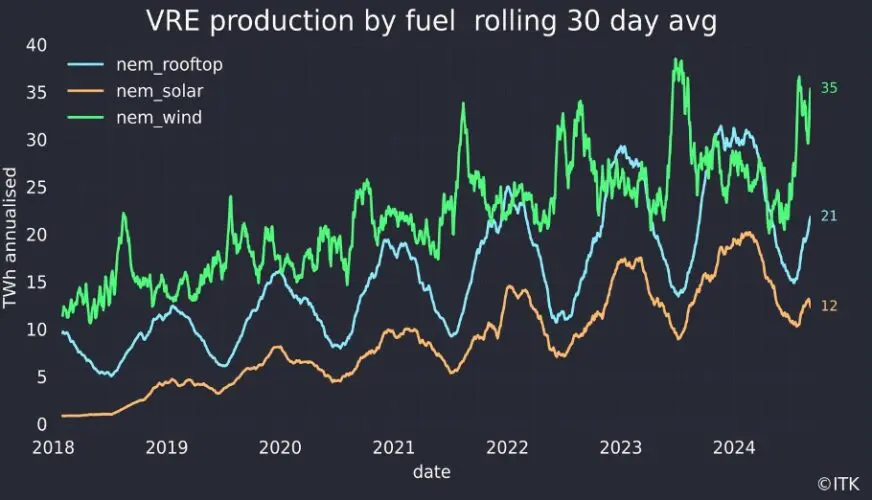
VRE production. Data source: NEM Review
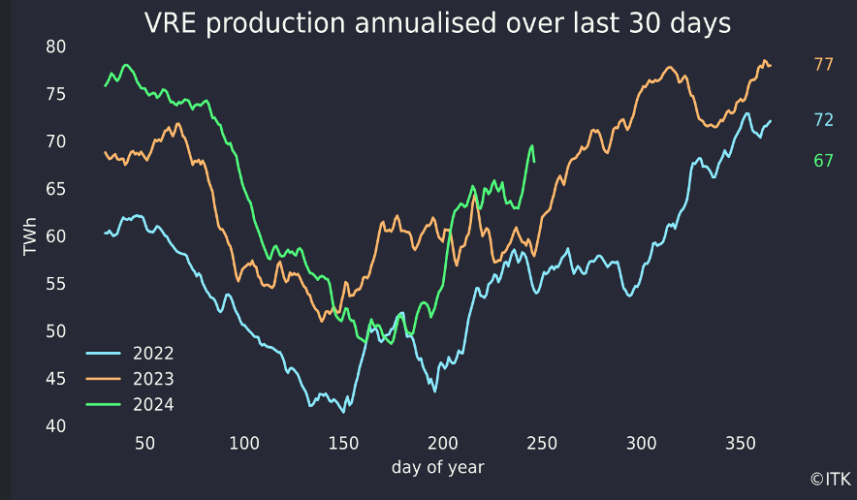
VRE by fuel. Data source: Nem Review
In the past 7 days across the NEM the share of coal generation has fallen to 49% and the share of VRE is up to 44%. Utility solar share is down, almost certainly because of the incredible level of curtailment.
Rooftop solar hasn’t been curtailed so its share is up: The VRE share in Victoria is 50% for the week and 42% in NSW. Queensland’s share is still not that high.
In Queensland, the first metered generation has been recorded from the 1 GW Macintyre wind farm, and the same from Golden Plains in Victoria. The contribution from those two big wind farms is zero but that some metered generation is showing up shows progress over the past couple of weeks.
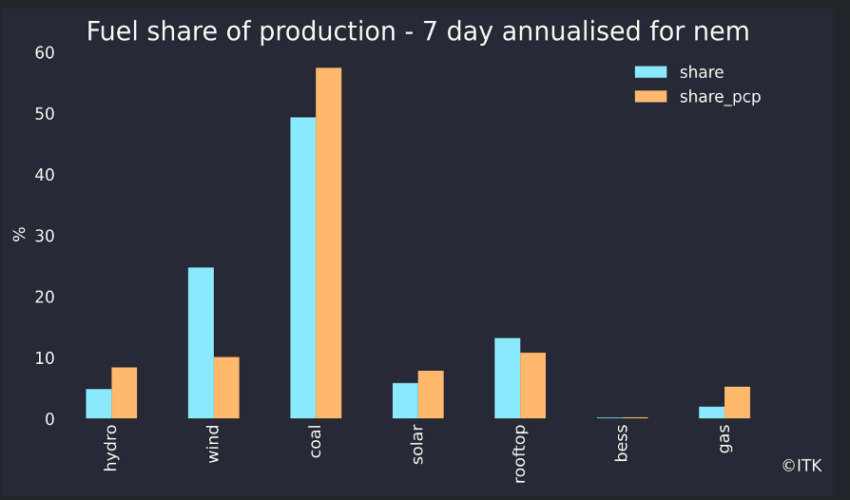
Fuel share of proaction. Data source:Nemreview
It’s worth noting again the system can already deliver more than this, it’s just that curtailment is necessary. Why curtail? Two reasons, (1) There isn’t enough storage yet, and (2) there is still a big bunch of must run coal and gas. That’s two obvious reasons, but there are probably other technical reasons to do with grid stability.
Prices have been driven down
Over the past seven days the wind surge has driven average spot prices negative in Victoria and South Australia. That’s despite a slightly sus price surge in South Australia one morning.
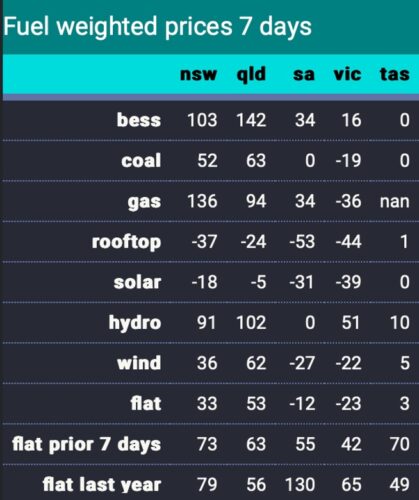
Fuel weighted prices. Data source:NEM Review
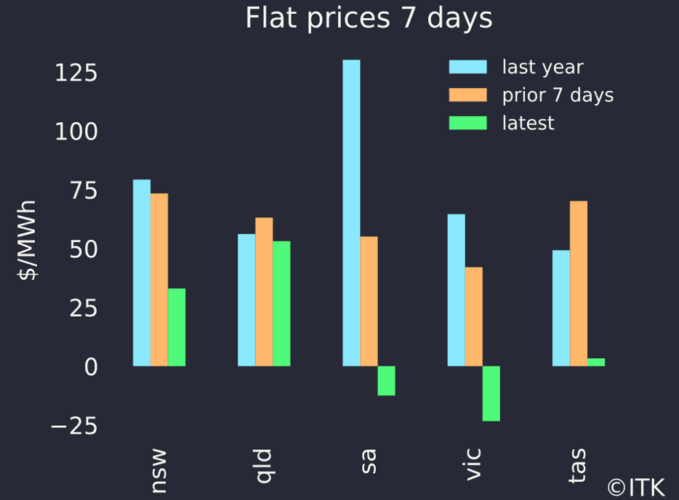
Fuels weighted prices. Data source:Nem Review
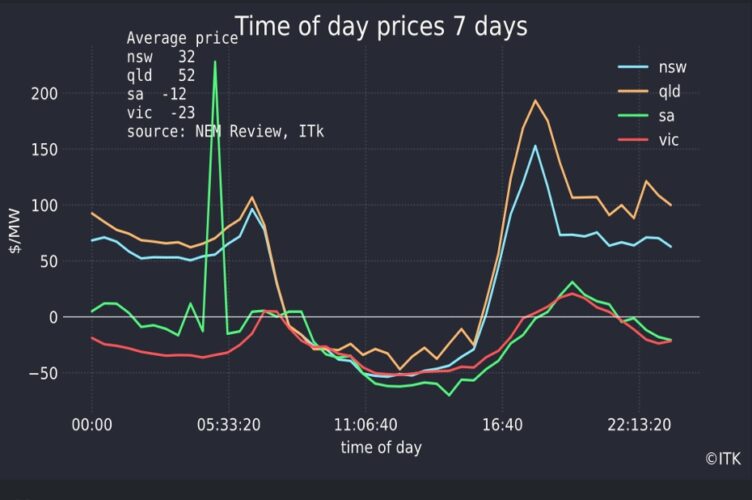
Time of day prices. Data source:NEM Review
Not using gas or hydro at evening peaks lowers prices
Using Victoria as an example we can compare the past 7 days.
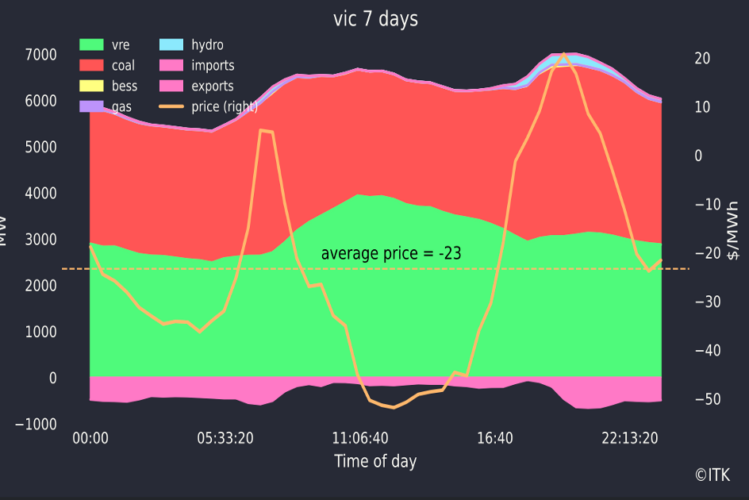
Victoria mix and price. Data source:NEM Review
With the past 365 days. For the year as a whole the hydro and gas generation required in evening and morning peaks and the lower level of VRE means prices averaged $78 with a peak hour average price spike of $200/MWh. Batteries increasingly contribute to the price spike when they can.
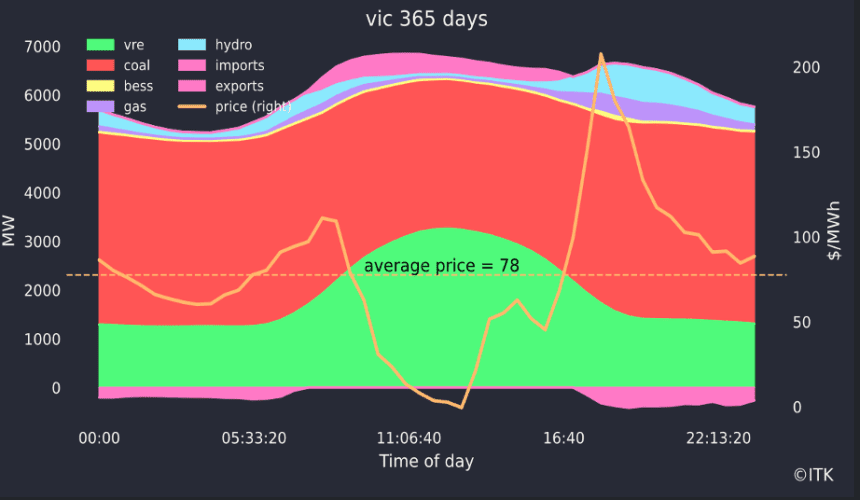
Victoria – the year. Data source:NEM Review

