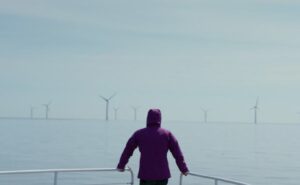
Spring is the season of high renewable energy percentages, thanks to the mix of good conditions for wind and solar and mild temperatures, which keeps the temperatures, and grid demand down.
Over the past week, South Australia has averaged more than 90 per cent wind and solar – meaning it generated enough wind and solar to meet more than 90 per cent of its local demand needs.
It exported, or curtailed, the surplus, and imported some when needed. It exported (26 GWh over the seven day period) slightly more than it imported (23.8 GWh)., And the average price? Just below $12/MWh, averaged over the week.
This graph, courtesy of OpenNEM, shows what that looks like for the grid energy mix. Wind provided the bulk with 57 per cent, rooftop solar provided one quarter of all demand needs, and large scale solar just 6 per cent, although it was heavily curtailed.

How will the state get to 100 per cent? And when? The state government says, somewhat loosely and with little ambition, that it will get to “net 100 per cent” reenables by 2030. The likelihood is that it could get there a lot earlier than that.
It will need some more wind and solar, but it is getting it, with the state’s largest wind farm, the 412 MW facility at Goyder South now under construction).
It will get another interconnector to the NSW to allow it to export more capacity when needed (and one is being built, Project Energy Connect, and that should be finished in 2025).
And it will need more battery storage (it has four operating batteries, at least three new ones are being built, and the federal and state governments have just launched a tender to fill in the project reliability gap in 2027 – in the early evening on a hot summer day – about the time the state could be running at net 100 per cent renewables.
It will also more work on grid security issues – managing excess amounts of rooftop solar, particularly when the interconnector(s) are down, and on providing system strength. South Australia has averaged more than 70 per cent wind and solar over the past 12 months, the highest in the world for a grid of its size.
This is another visualisation from OpenNEM on what the South Australia grid looks like, averaging out over the seven day period.
It shows that, on average, more than 100 per cent of state demand is met by wind and solar in the daylight hours, but more wind capacity is needed to fill in the gaps overnight, when more gas and imports are required.
And battery storage is also having a growing presence in the early morning and evening pricing and demand peaks.


