New calculations on line losses and grid congestion by the Australian Energy Market Operator has resulted in some new solar and wind farms suffering major losses in their calculated output – up to 22 per cent in the most extreme case.
The worst affected by AEMO’s newly released “marginal loss factor” calculations are those wind and solar farms located furthest from the main load hubs, in north Queensland, in western NSW and some in Victoria. Many projects have suffered cuts of between 10 and 22 per cent.
The MLFs are a critical part of a business case for any sort of generator, renewable or fossil fuel. They act as a “multiplier” of revenue and big cuts can seriously affect the business plan of a new or existing plant, and could “make or break” a project.
The MLF calculates the difference between how much is produced by the power facility, and measured at its meter, and how much is estimated to be delivered to customers, and so how much is paid, or credited, by AEMO.
They also apply to consumers, meaning that a manufacturing plant, for instance, located a large distance from supply will have to pay a “multiplier” of its actual demand to account for the anticipated losses over the network.
The calculation depends on a range of factors – the quality and length of the line, the existence or distance of local demand, and how much other generation is in the same area. And the estimates change each year.
The changes unveiled by AEMO in late March are dramatic for some plants, and represent what the market operator says is a major change in the way electricity is flowing across the grid.
In Queensland, for instance, the electricity is “flowing south”, rather than north, because of the increase in generation in the northern part of the state and the reduction in load in central Queensland.
However, the new assessments are being challenged by some wind and solar developers, and has sparked debate about the methodology used and the variability from year to year.
“These MLFs are essentially a multiplier for revenue of a plant and affects the economics in a material way,” said one project developer. “It’s going to be a real issue.”
A spokesman said AEMO has held discussions with stakeholders about the need for change in 2018/19 and will continue to listen to any stakeholder feedback.
“We are currently looking to consult with the market participants regarding possible changes to these MLF processes,” he said in an emailed statement.
“Initiatives such as the Integrated System Plan, looking specifically at renewable energy zones, and holistic national planning aims to optimise the power system, putting downward pressure on MLFs in the future.”
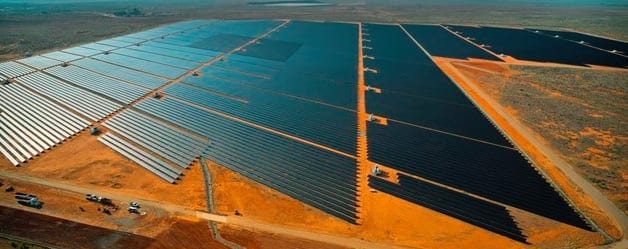
The worst hit in the latest assessment is the 53W Broken Hill solar farm, owned by the AGL-linked PARF, which has had its MLF calculation slashed from 1.2456 to 0.9789, or 22 per cent.
That means that for every 100MWh it produces, it will get paid for 97.89MWh. It had been receiving 124.56MWh.
(Ironically, the previous estimate of 1.2456 meant that it was deemed to be improving and benefiting the grid, before the new assessment. Many wind and solar farms still have an MLF of more than 1.0, meaning those facilities are considered a net benefit to the local grid).
In Queensland, the worst affected are the newly completed 50MW Kidston solar farm, owned by the listed company Genex, which is trimmed from 1.0115 to 0.8979, a loss of more than 12 per cent.
The soon-to-be-completed Clare solar farm suffers a similar percentage cut, going from 0.9823 to 0.8727, as does the Hughenden solar farm, also near completion, which is trimmed from 1.0115 to 0.8979.
The smaller Longreach solar farm goes from 0.9689 to 0.8934, and the Barcaldine solar farm suffers a similar reduction.
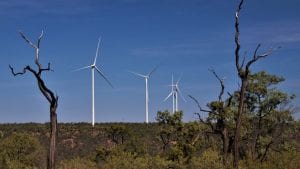
In Victoria, the Ararat and Kiata wind farms are the worst affected, suffering losses of 5 per cent, while the newly connected Gannawarra solar farm is also hit with a reduction to 0.9729 from 1.044 – a rating that will apply even though it will have a battery added by the coming summer.
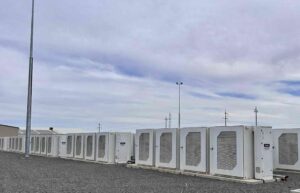
In South Australia, there is little change, although the new Tesla big battery at Hornsdale has had its MLF reduced slightly on its generation side – to 0.9771 from 0.9886 – along with a smaller reduction on its load side.
Wind and solar projects are not the only ones affected. Major coal and gas fired generators have also had their MLFs reassessed but the changes for these mostly centralised plants are mostly minor – some are improved, while many are also reduced slightly.
However, regional diesel generators and other peaking plant located at the edges of the grid are also badly affected for the same reasons as wind and solar farms.
These include Origin Energy’s Mt Stuart peaking generator in north Queensland, which runs on jet fuel, and is judged to suffer similar losses to solar farms in the area such as Kidston, Clare and Hughenden.
AGL’s Wattle Point wind farm in South Australia – soon to have a battery storage facility added – has the worst MLF of 82.79, probably because of its location at the end of a long line on the Yorke Peninsula.
The 91MW wind farm is only credited for 82 megawatt hours out of every 100 megawatt hours it produces. That means developers of such projects have to make sure the wind resource is good, or the price they are receiving is better than elsewhere.
Goldwind’s White Rock wind farm in northern NSW has a very low MLF of 0.8413 – also little changed from this year.
RenewEconomy talked to number of project developers and owners, who preferred not to be named because of the sensitivity of the issue.
They said there are major issues about the MLF calculations, which might have made sense in a centralised grid, but may need to be reassessed in a modern grid with distributed resources.
They noted that AEMO’s push to create renewable energy zones to group wind and solar projects in the same area may prove problematic, because it would risk similar assessment of over-production in one area, and cause a similar cut to assumed MLFs.
AEMO’s explanation centred on the increase in renewables in some regions, the decrease in loads elsewhere, the change in the direction of flows to and from a regional node, and the change in patterns of use in interconnectors linking different states.
 This graph to the right illustrates the power plants that suffered decreases in Queensland (purple) are all located to the north. Some in the south-west had their MLF increased due to lower fossil fuel generation.
AEMO noted that MLFs for connection points in Broken Hill have decreased by up to 22.7 per cent, including the solar farm.
“New generation projects connected near Broken Hill have resulted in projected generation in the area increasing by over 85 per cent, increasing the projected power flow toward the RRN substantially,” it noted.
That suggests that the Broken Hill solar farm is affected by the construction of the new 200MW Silverton wind farm, also owned by PARF. MLFs at the connection points close to Parkes, Forbes, and Griffiths – where three new solar farms have recently been installed – had also declined by up to 5.6 per cent.
“These are risks that are only just starting to be understood,” said another developer. “It does create a new problem.
“There is talk of some review. The MLF calculations were set up in a world without distributed generation. Are they the right multiplier in a worldd of distributed generation.”
Another noted that the wind and solar farms in north Queensland had been worst affected, and noted a similar assessment would be made of any new coal generator in the region, although it is highly unlikely any such development would take place.
Update: An AGL spokesperson said in an email: “We’re aware of the changes but have no comment on the impact and plan no action.”

