South Australia is entering a new phase of its transition towards a 100 per cent renewable energy grid, with solar starting to become the biggest contributor to the state’s grid in the middle of the day.
Three times over the past week, the share of solar – both rooftop and utility-scale – has been at around 40 per cent during the midday hours, relegating gas and wind, which had previously fought over the number one spot, to second and third position.
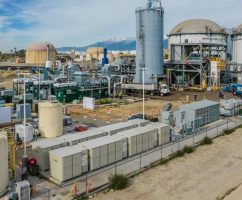
South Australia’s more than 800MW of rooftop solar has often contributed one-third of the state’s power output for brief periods, but what is new is the addition of the 110MW first stage of the Bungala solar farm, which will be the biggest in the country once the second 110MW stage is complete next year.
This is just the start of some massive investments in solar power in a state whose only other large scale renewable energy investment was in wind – some 1800MW of it.
Apart from Bungala, the 106MW Tailem Bend solar farm is nearing completion, and the 280MW Whyalla solar farm being built by Sanjeev Gupta’s Simec Zen Energy is about to get under way, with plans for up to 1GW of solar and storage.
Tilt Renewables has plans for a 44MW solar farm to accompany its Snowtown wind farm, and says there is potential for 300MW of solar at that site. Adani Renewables recently received planning approval for its solar farm, and DP Energy is hoping to soon begin construction of its solar-wind hybrid near Port Augusta.
And there are various smaller solar farms, such as 4.8MW Peterborough solar farm, and the 6MW Port Pirie solar farm from Renew Power, and the 6MW solar farm in Whyalla built by SSE.
And, of course, there will be the 150MW Aurora solar tower and molten salt storage plant in Port Augusta, which is due to be completed by US developer SolarReserve in 2020.
 As this graph from Opennem.org.au illustrates, solar became the biggest supplier on four occasions last week – Monday, Wednesday, Thursday and Saturday – when its share reached 40 per cent. It should be pointed out that solar’s total share of the week was still at a relatively small 7 per cent, but this is expected to grow significantly as the pipeline of new projects joins the grid.
The Australian Energy Market Operator expects the state’s growing rooftop solar to eclipse minimum demand on occasions within the next two or three years, creating complications for keeping the grid in balance and underlining why it wants the ability to “orchestrate” distributed energy systems, and why the state government in keen to subsidise the uptake of household battery storage.
AEMO expects that with the existing plans by developers and the likes of Sanjeev Gupta, the state will likely reach 73 per cent renewables by 2021, and even generate the equivalent of 100 per cent of its demand from renewables by 2025 – although the grid will remain connected with the rest of the country and will export and import at different times.
Energy analyst Hugh Saddler, in his monthly National Energy Audit written for The Australia Institute, this week noted that wind generation in South Australia reached record levels in August, in terms of both average daily generation and share of total electricity supplied.
This is shown in Figure 10 below. Wind generation and grid scale solar generation contributed 58.5 per cent of total electricity supplied in the state and gas generation 46.2 per cent of total electricity supplied, with a further 5.7 per cent from rooftop solar.
 Saddler notes that “clearly these fractions add to more than 100 per cent”, and that’s because South Australia was a net exporter of electricity to Victoria during August, as it also was in July.
The record share of renewables mean that for most days during July and, particularly, August, average spot wholesale prices were at or below the levels seen in the other mainland states.
For August as a whole, average wholesale prices were $72 per MWh in South Australia, $79/MWh n Victoria, $82 per MWh in Queensland and $93 per MWh in New South Wales.
However, during July, South Australia had a higher average price, because on several days during the month prices spiked to very high levels for short periods, including on July 8 when local generators took advantage of maintenance of the main interconnector and ensure that prices stayed at extraordinarily high levels all day.
As the recent ACCC report has pointed out, these price spikes occur much more frequently in South Australia than in the other NEM regions, saddler notes, mainly because the ownership of generators is highly concentrated, meaning that competition between generators is frequently absent.


