Australia has experience over the last few years a huge influx of investment in large scale solar farms – a technology that didn’t exist in the main National Electricity Market eight years ago, and barely existed, beyond a handful of plants, even five years ago.
Since the 20MW Royalla solar farm was opened in 2012 near Canberra – part of the ACT’s shift to 100 per cent renewables – another 50 or so large scale solar farms with nearly 4,000MW of capacity have been built, almost all of them in the last three years. Even more are under construction or in the pipeline. But it hasn’t worked out as well as expected for some of them.
As RenewEconomy has been reporting over the last couple of years, delays in project construction, delays in connection and commissioning, cost-overruns, damages claims, equipment problems, and constraints imposed by negative prices, grid congestion and system strength issues has taken a heavy toll on contractors, developers and owners.
Some contractors have collapsed or left the market, and many big international investors have been burned by the experience – some so badly that they have decided to quit Australia and spend money elsewhere.
But which large scale solar projects have done well, or chosen wisely, and found a sweet-spot on the grid and in the market, and which large scale solar projects have not? One of the best visualisations we have seen came from this slide below from Rystad Energy analyst David Dixon during the webinar hosted by RenewEconomy earlier this week.

It’s a complex looking graph, but basically it charts two important numbers – the capacity factor of individual solar farms over the past financial year, and MLF (or marginal loss factor), which shows its vulnerability to grid congestion.
(An MLF of 100 per cent means it is near load and will get credit for all its output. An MLF well below 100 per cent, like Broken Hill – just above 75% – means it is a long way from load, and will only get credit for that percentage credited to its output).
The graph shows the solar farms that have hit what is – for now – the sweet spot in the grid, with both high MLFs and high capacity factors, meaning that the output has not been constrained by negative prices, grid congestion, network constraints or other factors.
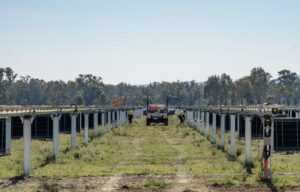
They are found in the top right box, including the Beryl solar farm (picture above). Bungala 1 in South Australia is also in that box, although the same can’t be said for Bungala 2, which has faced so many delays it doesn’t even rate a mention in this graph, although it is now producing some power.
It should be noted that even these projects aren’t shielded from market changes. As Michael Mazengarb writes, New Energy Solar has been forced to write down the value of Manildra because of lower wholesale prices. It also owns the Beryl project.
Those in the top left are doing OK for now, but look to be in parts of the grid that could face issues down the track, Dixon says. Those on the bottom right are in good parts of the grid, but have experienced other issues such as equipment failures or negative prices, or in the case of the Sun Metals solar farm, a combination of equipment issues and the newly emerged system strength issues.
Those on the bottom left must be feeling like they drew the short straw. These are the ones with multiple challenges – low MLF, poor grid position, negative pricing events and/or equipment issues. They include the West Murray Five, the five big solar farms – Bannerton, Broken Hill, Gannawarra, Karadoc and Wemen – that had their output cut in half for more than seven months while voltage “oscillation” problems were resolved.