Renewable energy generation has notched up another record month on Australia’s National Electricity Market, with October marking the fifth consecutive monthly record on both total generation and share of NEM generation.
In its latest National Energy Emissions Audit, The Australia Institute said grid connected renewables had supplied 16.5 per cent of total NEM electricity in the year to October, with wind and solar at 8.2 per cent and hydro 8.3 per cent – a 20 per cent increase on penetration since the start of the year.
Factor in the huge capacity of installed rooftop solar on the NEM, and the share grows to 19.9 per cent. But while that’s helped keep the electricity sector down on emissions, they are rising elsewhere, as new government data shows (see below).
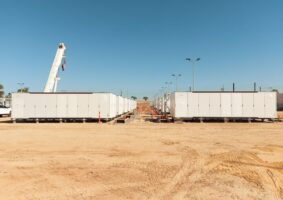
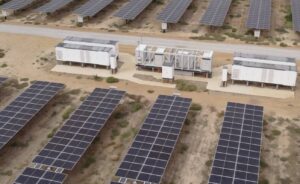
The latest records have been driven exclusively by big solar, the report notes, with the addition of eight large-scale PV farms coming online in the last two months, four of them in October.
The October projects included the 20MW White Rock solar farm in New South Wales; Daydream in Queensland (180MW), Bungala Two in South Australia (140MW) and Karadoc South in Victoria (112 MW).
 You can see the “upsurge in solar capacity” in Figures 6 and 7, below.
The new solar additions have taken total installed capacity of solar farms supplying the NEM to nearly 2.3GW at the end of October, up from 270MW just a year ago, the report says.
 And while there were no new wind farms added the grid during September and October, that is set to change, with a number currently under construction.

On a state by state basis, Tasmania’s renewable share of generation was 93.4 per cent for the month; in South Australia, 50.2 per cent; in Victoria 19.5 per cent; in New South Wales 12.5 per cent; and in Queensland 7 per cent.
“Renewable energy generation records continue to be broken and the level of renewables on the grid continues to rise. It is clear we can only expect more to come,” said Dr Hugh Saddler, energy expert and author of the report.
“If the government truly wants more reliable energy and lower power prices, they should look up not down.
“The future is in renewables. Australia just witnessed eight large scale solar plants coming online in the last two months, increasing solar capacity connected to the NEM grid by over 50%. Unless taxpayers foot the hefty bill, it is unlikely we will see any new coal power plants being built again,” Saddler said.
But coal generation has not been the only casualty of cheap and abundant renewables. Gas generation has been hit too, experiencing a uniform decline across the whole NEM that Saddler describes as “quite striking.”
This decline across all five NEM states is illustrated in the below chart, and according to Saddler has been driven mainly by the high cost of gas, and competition from rapidly growing wind and solar generation.
 In terms of emissions, however, the gas decline has had a negative impact, with no change in electricity sector emissions despite the increase in renewables.

Figure 4 shows that the lack of progress in reducing emissions was caused by a continuing fall in gas generation, which was made up by increased black coal generation, the report says.

But that is what happens when you have no price on carbon, nor any other policy disincentives to burn coal, Saddler notes.
“As a final observation it is worth noting that, while wholesale gas prices remain high, combined cycle gas generation is uncompetitive relative to most coal generators.
“A financial constraint on emissions from electricity generation would level the competition between gas and the much more emissions intensive coal.
“In the absence of any financial penalty for greenhouse gas emissions, renewable generation will probably to continue displace gas generation, rather than coal, particularly in Queensland.
“It follows that emissions reductions will be less than they would be if renewables displaced coal generation.”
This much is true, and it is an important message to the federal government, on the same day that it released its own National Greenhouse Gas Inventory for the June 2018 quarter.
The findings of that report show that in the year to June 2018, Australia’s overall emissions have increased by 0.6 per cent (including land use, land use change and forestry).

Fugitive emissions from the production, processing, transport, storage, transmission and distribution of fossil fuels such as coal, crude oil and natural gas increased by 5.2 per cent over the year to June 2018, driven by a 14.2 per cent increase in natural gas production and 0.2 per cent increase in coal production.
And in the transport sector, emissions increased 2.6 per cent over the year to June 2018 – growth that was reflected in a 7.6 per cent annual growth in diesel consumption for the year to June 2018.
This data, plus the current plateau in electricity emissions reductions – they fell by 2.6 per cent in the first half of the year – sets a worrying trend for Australia’s climate contribution.
“As our Environment Minister heads to the UN climate negotiations in Poland, there’s no sign Australia will be able to meet our international commitments under the Paris Agreement, including the inadequate 2030 target for a 26-28 per cent cut in climate pollution against 2005 levels,” said Australian Conservation Foundation economist Matt Rose in comments on Friday.
“Unfortunately, the Morrison Government has no policies to address this pollution blowout,” Rose added.
“Meanwhile, (it) supports Adani’s proposed coal mine, which will further add to the world’s warming problem and bring on more heatwaves, more bleaching of the Great Barrier Reef and will contribute to more bushfires like those in Queensland.”