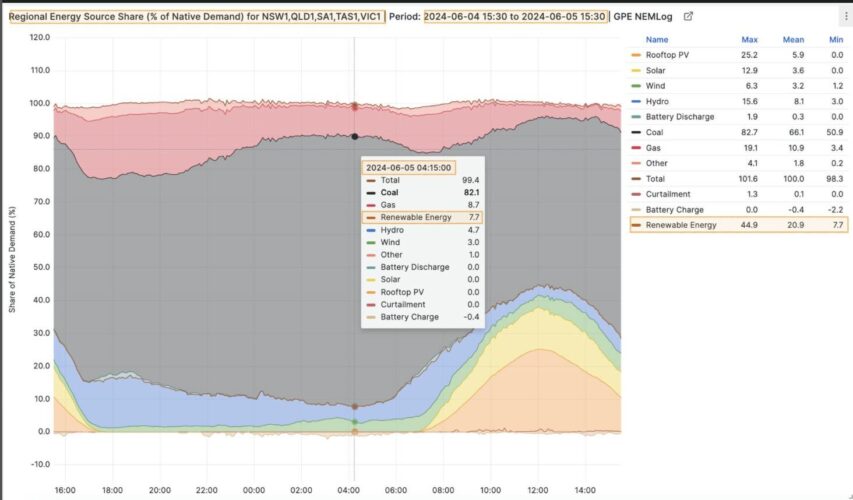
The output of renewable energy on Australia’s main grid hit its lowest level in four years early on Wednesday morning, as both wind and solar performance fell below average levels in what is already usually a weak time of the year.
The four-year low for instantaneous renewable output was record at 4.15 am on Wednesday morning when it fell to 7.66 per cent, the lowest share since it hit allow of 5.05am on June 6, 2020.
The downturn was not just instanteous either. Geoff Eldridge, an energy analyst from GPE NEMLog observe it was also the lowest one day mean output on the main grid for renewables for two years at just 5,561 MW, and the lowest one day rolling mean share of 20.9 per cent for three years.
“As we transition towards a more sustainable energy future, understanding the variability of renewable energy output is crucial,” Eldridge noted in a post on LinkedIn. “Today, we’ve seen notably low renewable energy records, typical for this time of year, marked by decreased solar and wind contributions.
While spring is normally the season of records at the top end of output, autumn and winter are typically the most challenging period for renewables, and one of the reasons many analysts and observers say long duration storage will be needed to cover these periods. Summer variability is usually covered by extended periods of solar during the day.
“Today’s records underscore the importance of diversifying renewable sources and investing in energy storage solutions,” Eldridge says.
“Improved forecasting, planning, and public awareness are also essential to manage the grid effectively during low output periods.
“As we continue to face challenges with the expected low solar and wind outputs for this challenging time of the year, the need for robust energy storage systems, at all levels, becomes increasingly critical to ensure a stable and reliable energy supply.”
One analyst looking at these needs in detail is David Osmond, a wind engineer from Windlab, who for the past three years has been running a simulation that upsizes the current capacity of wind and solar to a notional 105 per cent of annual grid demand, and monitors how that goes on a daily and weekly basis.
Osmond’s thesis is that the grid can be run very close to 100 per cent renewables with just 5 hours of storage (24 GW / 120 GWh), and says it has averaged 98.9 per cent over the past three years.
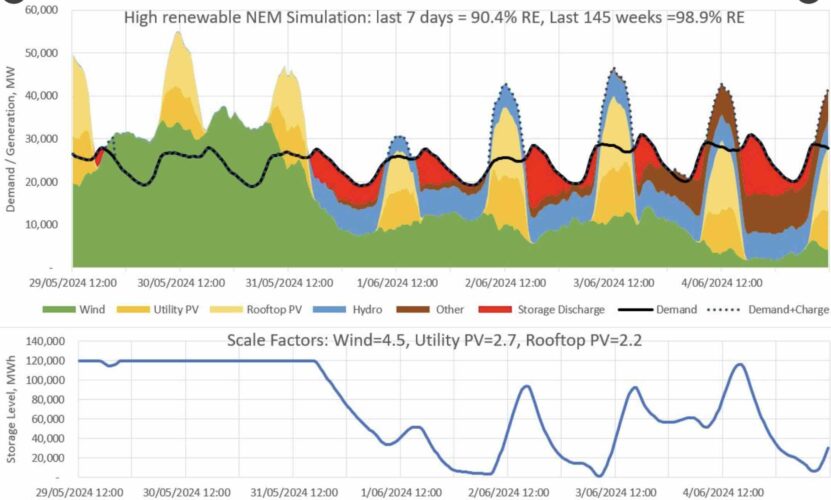
The latest week, which included the four year instantaneous low on Wednesday morning (the weekly simulation runs between Wednesday noon), was one of the most challenging, but it still delivered a renewable share of 90.4 per cent over the week.
This graph above shows the impact of low wind and solar, with a lot more storage needed (in red), and then “other” – mostly peaking gas but it could also include hydrogen and demand management in the future – in brown.
Osmond observes that the worst case need for back-up capacity – the “other” – during the almost 3-years of simulations is a little over 9 GW, which occurred in July last year.
” We got pretty close to that again last night,” he said. “It wouldn’t surprise me if sometime in the next few years that this increased to 10-11 GW.”

