New South Wales showed off its large-scale renewables chops in November, supplying nearly one-third of the electricity generated by all Australian utility PV and wind assets over the month – and dominating the charts for the best performing big solar assets.
The latest data from Rystad Energy shows reveals that the nation’s large-scale solar and wind assets generated a total of 3,848GWh in November 2023, a rise of around seven per cent from 3,588 GWh in November 2022.
Rystad’s David Dixon says NSW led the pack, generating a total of 1,125GWh of renewable electricity, with 682GWh from utility PV and 443GWh from wind.
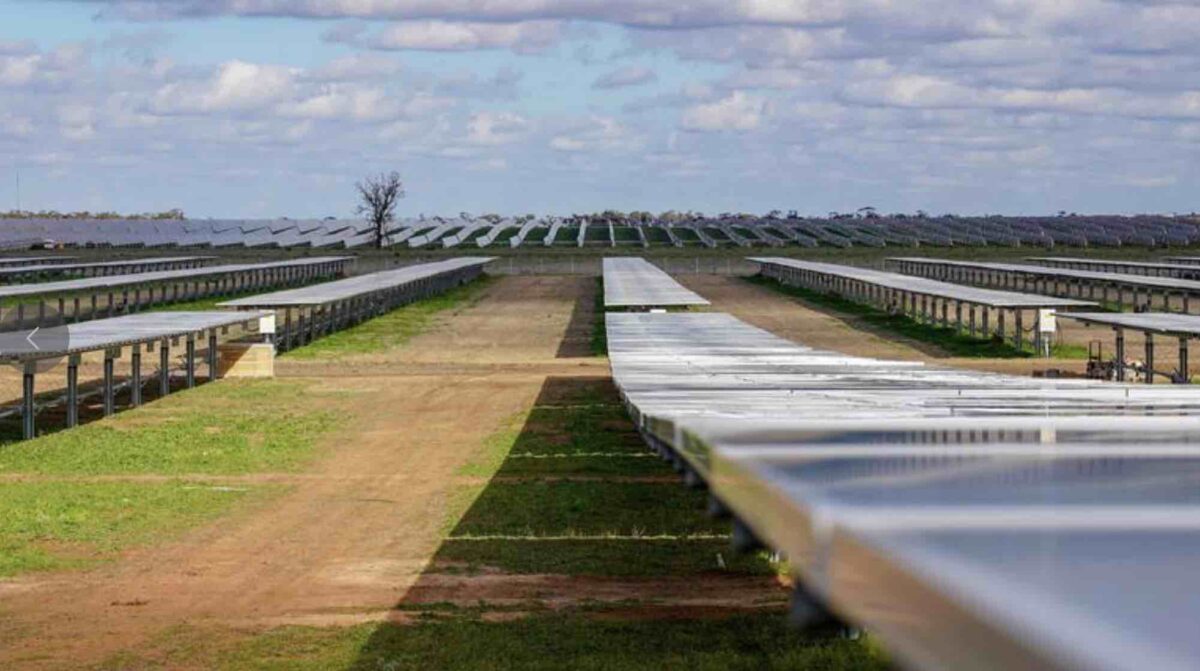
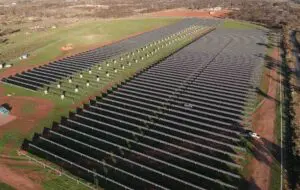
You can see in the chart below the sea of blue, with NSW solar farms representing 13 out of the top 20 of the nation’s best performing assets for the month – with the exception of the top spot, which again goes to Sun Energy’s Merredin solar farm in Western Australia, with a capacity factor (CF) of 39.8%.
Otherwise, the star NSW performers include Neoen’s Griffith solar farm (CF 35.3%), RWE’s Limondale 1 & 2 solar farms (CF 33.9%) and FRV’s Moree solar farm.
The strong performance of the NSW solar farms may have as much to do with good solar conditions and locations as they do with the number of negative price events, with NSW less exposed to market movements that could cause them to be curtailed by their owners.

In large-scale wind, it’s a different story, with little representation from NSW projects in the top assets for the month and Victoria’s small 57MW Cherry Tree wind farm (Atmos Renewables) in number one spot with a capacity factor of 46%.
Dixon says the top-performing state for the month was Western Australia, which was host to three of the top five assets, including REST Industry Super’s Collgar wind farm (CF 45.4%).
“Volatility was high across all states except Tasmania / Victoria, with the 30 minute intraday spread exceeding 450 A$/MWh in NSW, QLD, SA and WA,” Dixon says.
“Operational demand in Western Australia reached new highs, exceeding 4GW, far outside the historical range.”
You can read more about the Spring heatwave that helped smash the seven year-old demand record on WA’s main grid here.

