The next three years will be huge for utility renewables in Australia. Given the timeframes for financing, constructing and commissioning new plants, we expect all currently committed capacity to be fully online by the June 2024 quarter.
And that’s a lot of capacity. With 9.4 GW of projects either commissioning, being built or otherwise committed to construction, we expect fully operational wind and solar in the NEM to almost double from today’s level in three years.
Our commissioning forecast is hostage to a whole host of risks, but we expect new volumes hitting the market to average between 500 MW and 1 GW per month for the next two years before slowly tailing off as committed projects reach completion.
Wind projects dominate the volume of new committed project capacity coming online, at approximately double the amount of solar.
And New South Wales sees the most growth by state, despite the flurry of new commitments in Queensland through 2020.
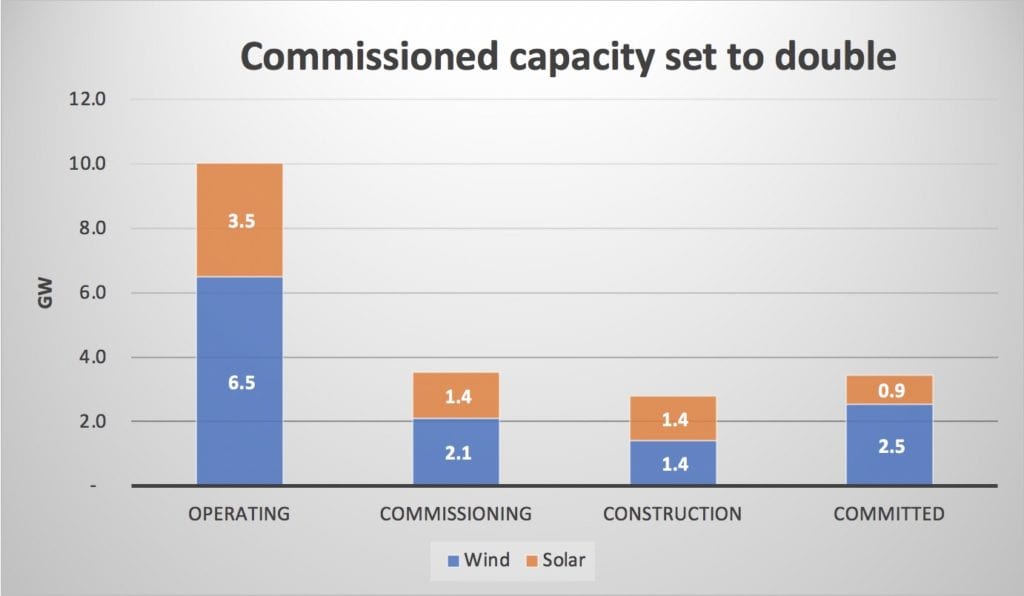
Included in the commissioning capacity are large projects that are already close to fully commissioned such as Dundonnell and Coopers Gap wind farms.
Also included in commissioning are about 700 MW of solar farms including Darlington Point, Limondale 1 and Kiamal Stage 1.
Leaving aside the commissioning assets there are still about 6.5 GW of “committed” utility scale projects, and none of these numbers incorporate the NSW Road Map.
Behind the meter is now an integral part of the system
In our latest quarterly update, ITK significantly increased our estimates of rooftop solar installations and yet our annual growth still represents a mild slow down from what was achieved in 2020.
We think the growth in behind the meter is mainly driven by its cost effectiveness and ever increasing community acceptance. Capacities of panels are increasing, reducing installation costs and the amount of roof area required.
We expect inverters are improving in both capability and cost effectiveness.
Even having said all that we really have no idea of how to forecast rooftop installations. In ITK’s foreasts we have limited the ultimate penetration to something like 50-60% of all detached houses.
Not explicitly modelled, but included in the total, is the non household behind the meter segment, car parks, shopping centres, schools, hospitals, and private enterprise.
The average size of these installations appears to be increasing with Sunwhiz noting several installation in the 1-10 MW capacity range.
For instance, McCain foods has an 8.2MW system and Melbourne Airport 12.4MW. For a gentailer, such as Origin, AGL or EnergyAustralia, 12 MW is a substantial piece of business to have gone walking out the door.
And for the entire rooftop sector there exists the possibility of retrofitting storage at either the installation or community level.
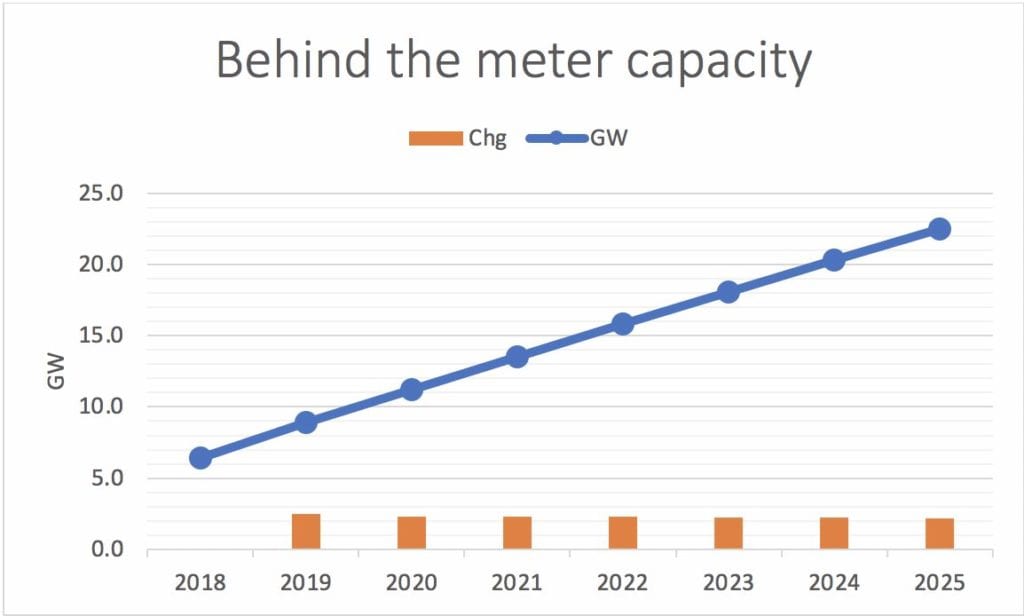
So, by 2025, in capacity terms, ITK expects behind the meter to be as large as the utility scale wind and solar sectors combined, but the output will be less than 50% of utility scale.
Still, if there is 20 GW of rooftop and 7 GW of utility scale solar in 2025 one should not be looking for big power prices in the middle of the day.
Is the industry ready for it?
By now you would think stakeholders would be well prepared for the deluge of new supply, but we still have reservations.
ITK’s longstanding bugbears are around transmission and system control. AEMO losing its CEO won’t improve this.
Rulemaking and policy is difficult when there is a fast moving target and there is still arguments about the agenda.
ITK expects prices to be soft for most of this decade
We expect flat load price annual averages to be below $50/MWh for the remainder of the decade, unless some coal stations close earlier than in our base case.
As compared to what we were forecasting in October 2020 we now expect prices to be materially lower between 2028 and 2035, largely due to the impact of the NSW roadmap

Solar prices will be especially soft
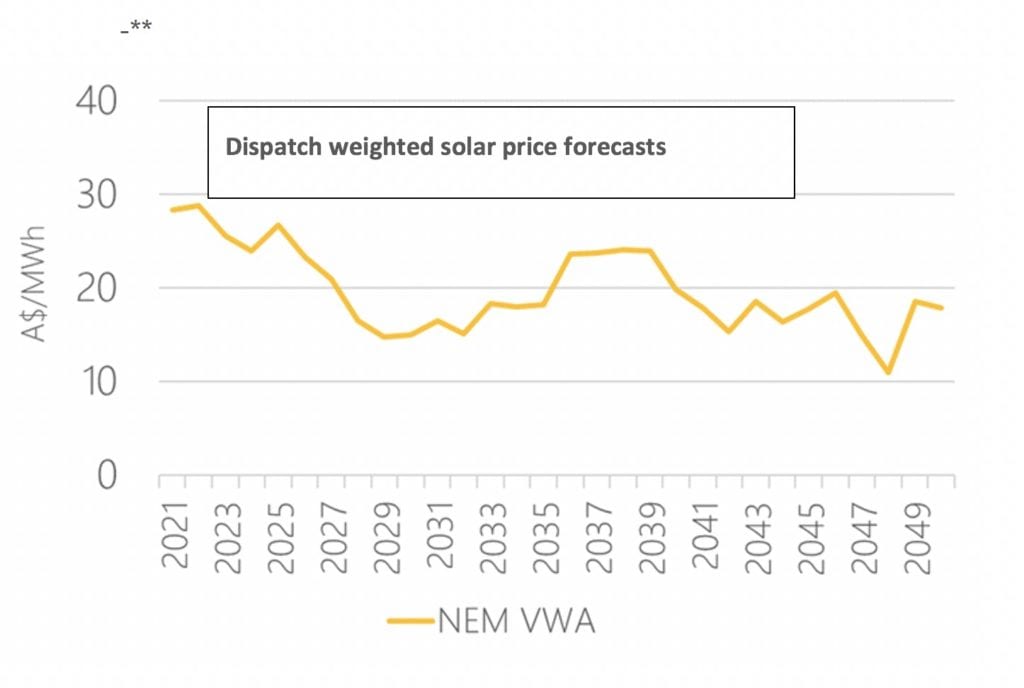
We presently forecast utility solar dispatch weighted prices to fall gradually and be below $20/MWh by 2030.
ITK’s merit order model shows how gas loses its price setting role over time
The following charts show ITK’s forecasts of the average price for each hour of the day for 2021, 2035 and 2040 in NSW. They are a great set of charts by my colleague Ben Willacy.
The colours in the charts show which fuel is setting the price at a particular time of day.
In 2021, we expect coal and gas will continue to set the price for most of the day.
By 2035, we expect storage to be setting peak prices and by 2040 storage sets the price most of the day.
Our only caution is that with the continue evolution of the market our forecasts for 2030 and beyond should be treated cautiously.
It is a new world we are going into and there will be lots for everyone to learn. Lots of opportunities for new comers to add a lot of value.

New supply is showing up in the actual data
The total share of wind and solar is 23% over the past 30 days compared to 18% at this time last year.

Despite the fact that the annual seasonal peak of solar production is around the October – November period, and not January – February as some might expect, we nevertheless see rooftop solar responsible on its own for 9% of total supply.
That’s an incredible feat, with more to come.


