One of the newest wind farms in Australia, and the newest in its home state of Western Australia, has once again topped the performance rankings for the sector in August, posting a near record-breaking capacity factor of 61.1 per cent for the month.
The 76 megawatt (MW) Flat Rocks wind farm, near Kojonup in the south-west of W.A., has topped the rankings for wind farm performance for two months in a row, and – curiously – was the only wind project in that state to make it to the top 20, according to data published by energy analysts at Rystad Energy on Tuesday.
The rest of the top performing wind farms were scattered across South Australia, Victoria and Tasmania, all boosted by the huge weather system that swapped across the south of the country in the past week.
Among those posting monthly capacity factors of more than 50 per cent were the Granville and Cattle Hill wind farms in Tasmania, the Berryback, Mortons Lane and Dundonnell 3 wind farms in Victoria, and the Hornsdale 1 and 2 wind farms in South Australia.
Flat Rocks is one one of the few wind farms located south of Perth, in a region which enjoys strong wind conditions in winter. Most of the state’s wind capacity is north of Perth, and have better results in summer.
The top ranking solar farms all went down to location, with Queensland predictably providing 16 of the top 20 performing solar projects in the month of August, and north and west NSW the other four.
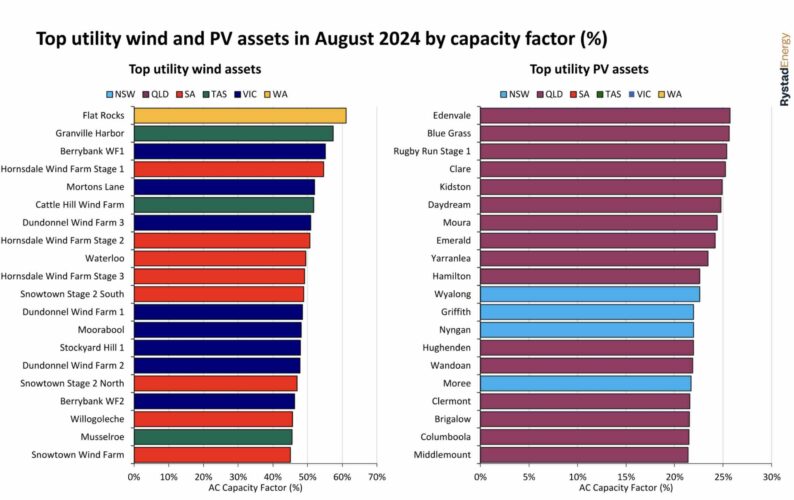
The best ranking solar projects, and those with capacity factors of 25 per cent or more, were the Edenvale, Blue Grass and Rugby Run solar farms. The best NSW solar farms were located at Wyalong, Nyngan, Griffith and Moree.
According to Rystad’s David Dixon, the combined output of all Australian utility PV and wind assets totalled 4,354 gigawatt hours (GWh) in the month, up nearly 20 per cent from 3,654 GWh in August 2023.
That is based on a more than 20 per cent increase in operational capacity – 23.3 GW vs 20.4 GW. Dixon notes that the average capacity factor for the month was 29.8 per cent, versus 27.1 per cent in the same month a year ago.
But solar capacity factor fell to 17.4 per cent from 19.6 per cent, probably as a result of the negative wholesale prices which fell mostly in the middle of the day thanks to the influence of rooftop solar PV.
At a state level Victoria was in top spot generating 1,321 GWh with 102 GWh from utility PV and 1,219 GWh from wind.