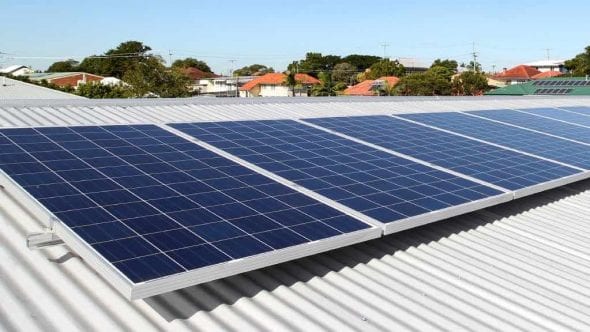
In Australia, the number of PV systems has grown phenomenally over the last decade, with a total installed capacity of over 6.2GW as of June 2017. Although PV systems are very reliable, conditions in Australia can be very harsh and so equipment can fail or output can simply be suboptimal. Very little information is available on the types of problems that occur, where they occur and how often.
To address this, a web-based survey has been developed to capture typical faults in PV systems when exposed to the range of climates in Australia. It will help to improve future PV system design, installation practices, component selection, product development and product approvals for Australian conditions.
The survey has been coordinated by Murdoch University, with support from the Australian Renewable Energy Agency (ARENA) and the Australian PV Institute (APVI), and with input from the Clean Energy Council (CEC), UNSW and Ekistica.
Anyone who owns, operates, installs or inspects PV systems can enter their experience of faults in PV systems via a new “PV Module and System Fault Reporting Portal”, which can be found here. Module manufacturers are also encouraged to provide data collected from warranty returns.
The survey will be open until March 2018 and a summary of the information collected will be made publicly available through a final report posted on the Australian PV Institute (APVI) website.
Background
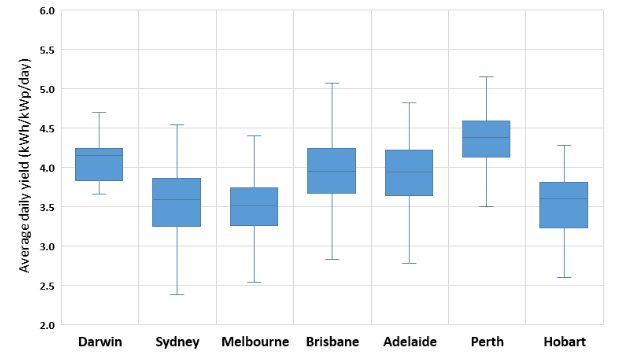
System faults can generally be classified in terms of component selection or installation quality, or a combination of both. A UNSW paper on analysis of distributed PV systems in Australian capital cities showed a wide range of performance. The worst 25% of systems had yields at least 10% lower than the best 25% performing systems in Darwin and Perth, while the difference was more than 16% in Sydney (see Figure 1 below). The study indicated that low performance can be only partially explained by non-optimal tilt and orientation.
Figure 1: Distribution of measured performance (average daily yield) of PV systems in Australian capital cities. The top and bottom of the box in the distribution represents the upper and lower quartiles (75% and 25%). 50% of the data therefore falls within this range. The vertical line indicates the median value. The whiskers indicate the full extent of the data, excluding outliers.
Previous analyses performed in Europe (Belgium and France) also showed that poorly performing systems can have yield losses of more than 10% compared to the best performing systems. In a large variety of cases, such underperformance was due to poor installation practices and a lack of quality control, yet these systems were not deemed to have large failures or faults on their own.
The concern for any investor in PV systems, whether they are a household with a 5 kW array, a factory with a 100 kW array, or the operator of a large multi-MW ground-mounted systems, such as those funded by ARENA’s Large Scale Solar Funding round, is the reliable and safe operation over the lifetime of the system, to achieve the expected financial return. Significant deviations from initial expectations, such as needing to replace PV modules earlier than expected, or failures of components such as the wiring used, can have a large and negative financial impact. A good overview of failures and failure modes of PV modules and systems worldwide can be found in this IEA PVPS Task 13 report.
The following figures illustrate examples of issues found from previous PV system inspections.
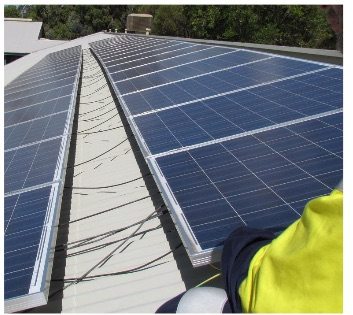 Figure 2: System with inadequate cable protection for PV wiring. This cable protection is needed as heat and especially UV radiation will affect the insulation of the cables. Over the expected lifetime of the PV system (25 years or more), these cables can deteriorate and increase the risk of short-circuits and fire, or will require expensive replacement work, thus affecting the financial return of the system.
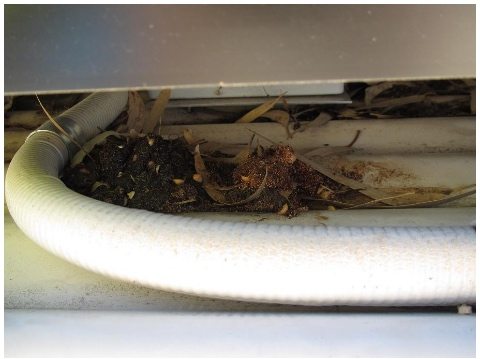 Figure 3: Example of accumulation of leaf litter under PV array panels due to the installation not facilitating self-cleaning. This is of concern because flammable material in close vicinity of a PV array installation presents a fire risk since high resistance faults (caused for example by component failures, bad joints or vermin activity) can lead to arcing.
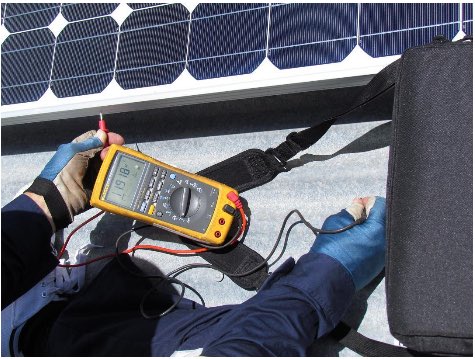
Figure 4: Unearthed PV module frame at potential relative to earth. Although 11.92V is not a hazardous potential, and unlikely to be detected without a Voltmeter, an unearthed PV array can be at a potential different from earth. This particular case was not hazardous when inspected. Under differing conditions and particularly in systems where transformerless PV inverters can cause capacitive leakage currents, missing equipotential bonding of framework and PV array support structures can pose an electrical shock risk.
Dr Martina Calais, Murdoch University
This article was originally published on RenewEconomy’s sister site, One Step Off The Grid, which focuses on customer experience with distributed generation. To sign up to One Step’s free weekly newsletter, please click here.

