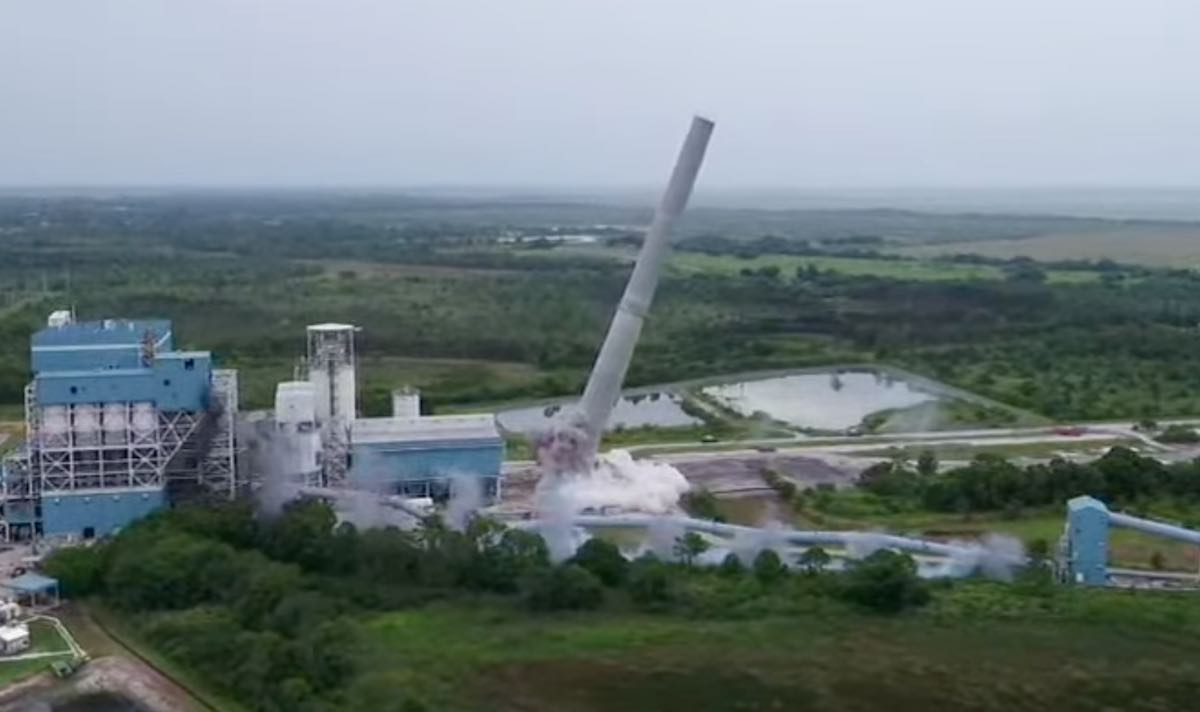
S&P Capital IQ note that in the US about 3.5GW of coal generation will close despite more than $3.5 billion of recent environmental spending, and also that due to state and federal renewable energy standards up to 33GW of combined-cycle gas generation will be uneconomic by 2030. That’s notwithstanding that most of that gas generation earns a capacity payment.
Should proposed Democrat legislation for a “Clean Energy Standard” become law over the next 12 months, as is possible if every Democrat Senator votes for it, then an 80% clean energy target as early as 2030 is in prospect.
Obviously, the outlook for gas generation would be a lot worse under that scenario, but it’s already bad. As electricity demand in the US is not growing, all the new capacity is helping to drive down prices, just as in Australia.
However, the US doesn’t have the risk that Australia does, because the existing fleet is far more diversified and much less dependent on just a few ageing, increasingly unreliable coal generators in the way that we are in Australia.
Of the estimated 40GW of power expected to come online in the US in 2021, about 80% (32GW) will be renewables.
In this note, ITK draws extensively from some work by Adam Wilson of S&P Capital IQ, the market intelligence and analysis arm of S&P.
S&P, along with Moodys, is the primary rater of corporate debt globally, and CFOs everywhere who have a company capable of sustaining a debt rating prepare for their S&P meetings carefully.
S&P Capital IQ appears to provide data and analysis in a style akin to an investment bank or a BNEF.
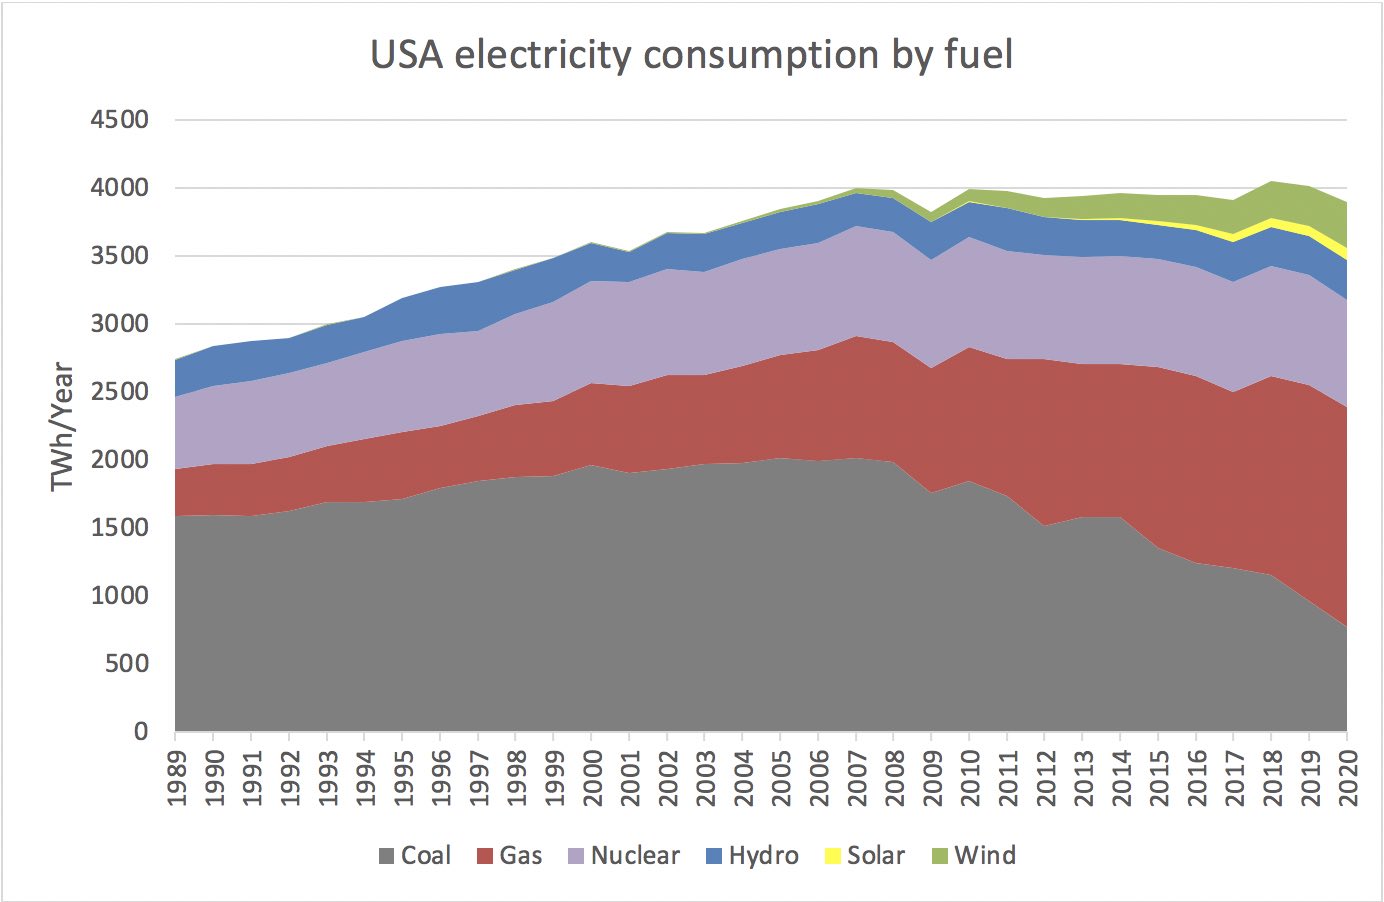
The US market is 20x the size of Australia and is dominated by coal, gas and nuclear fuel. Overall consumption has flat-lined over the past 15 years. Like Europe and Australia, this means that if renewables are to increase share they have to take it from existing generation.
Unlike Asia, industrial demand for electricity has flattened or even declined over time; and unlike Australia residential and commercial are just as large sectors as industrial.

It is interesting also to note that about 45% of USA residential electricity is devoted to temperature control and hot water.
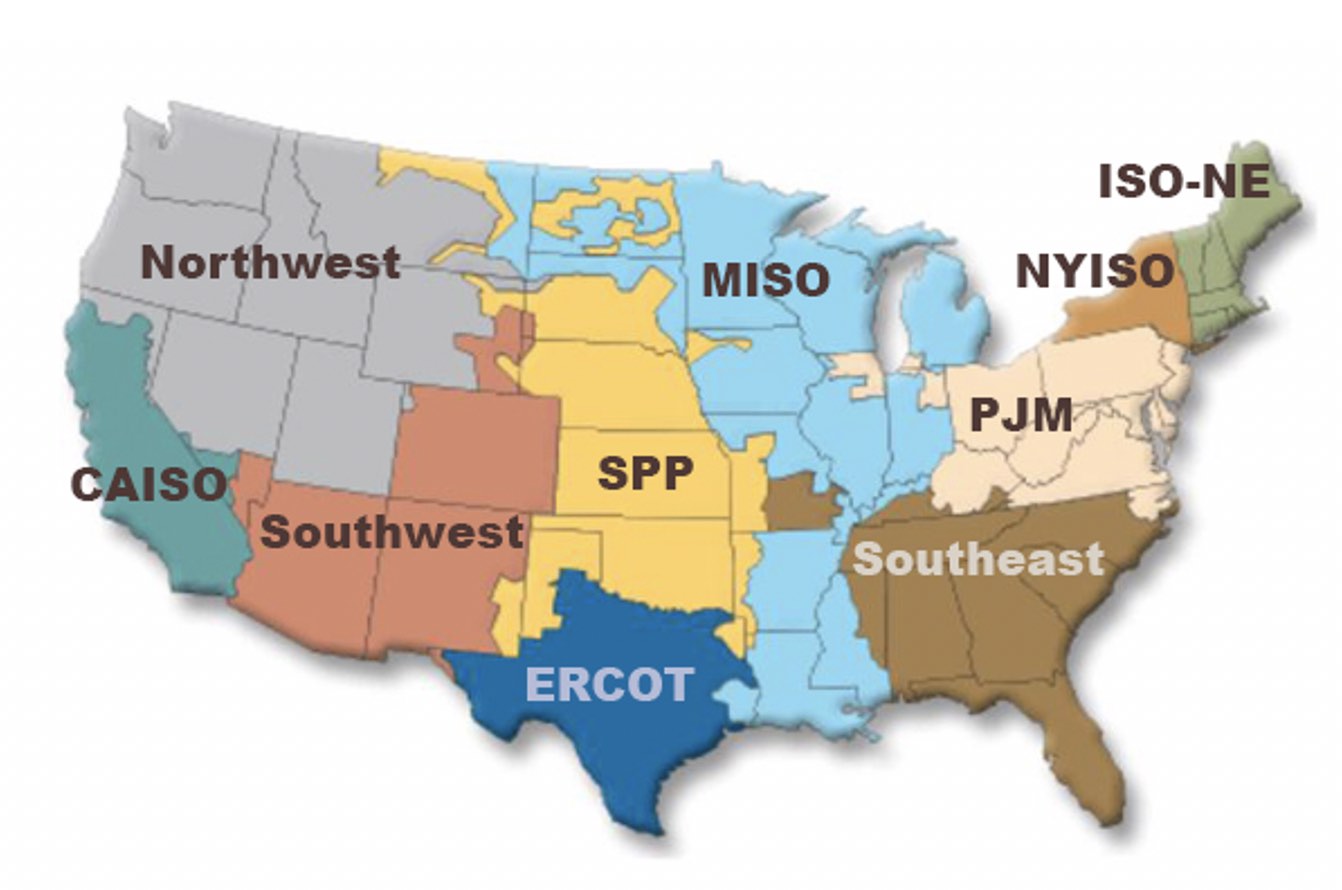
USA divides into regions when considered from a transmission and grid perspective. There are transmission links between regions to a greater and lesser extent, specifically Texas [Ercot] is only lightly inter-connected.
All of that is by way of overview.
A mix of federal and state policy incentives drives renewable energy
The primary renewable electricity federal incentive at the moment, as ITK understands it, remains the investment tax credit and production tax credits.
Wind projects can get $US18/MWh of tax credit for wind farms started in 2021 and completed within four years. Historically, the PTC has tended to be extended annually although the rate has fallen to 60% of 2016’s level.
The alternative ITC provides an upfront capital cost tax incentive which tends to suit solar, battery and perhaps offshore wind projects better. The ITC provides a 26% of capital cost tax credit through 2002 and 22% in 2023.
According to reports there are competing/overlapping Biden and Senate Finance Committee proposals, but both seem to have some sort of tax credit extended for 10 years.
ITK’s expectation is that there will continue to be ongoing federal-level support, as it has continued under various USA administrations and as there is a need.
Although the PTC and ITC likely set the minimum federal ambition, Democrat Tina Smith is trying to get the “Clean Energy Standard” into legislation, which would require utilities produce 80% renewable power by 2030.
That legislation, such as it is, has made the cut to be included as part of a proposed infrastructure bill. It has strong White House support.
For it to clear the Senate require supports from Sen. Joe Manchin from coal state West Virginia. In short, it might happen but it’s far from certain. There is also a competing bipartisan but far more modest bill, that wouldn’t even start until 10 years after it’s passed.
The federal proposal would broaden and be on top of the more than 30 state level supports, whether Renewable Portfolio Standard [RPS] or more generally. S&P shows these on a map:

No one will be surprised to note that the states with no target or goal are mostly strongly republican states in the south of the USA. However, note also that NextEra, the world’s leading renewable financier and investor is a Florida-based business.
Equally, not all the state targets represent reality. Tx shows on the map with a 10GW target by 2025, but ERCOT (90% of TX) already has 26GW of wind and 4GW of solar.
The point about these targets and the amount of wind and solar under development is exactly the same as in Australia. It puts existing thermal resources under financial pressure by reducing price and volume opportunities.
Specifically, the growth of renewable energy on the Eastern Seaboard is likely to start to pressure installed gas capacity in the same way that it already has in California.
S&P Market Intelligence speculates that up to $US68 billion of coal and gas assets could end up stranded in the USA.
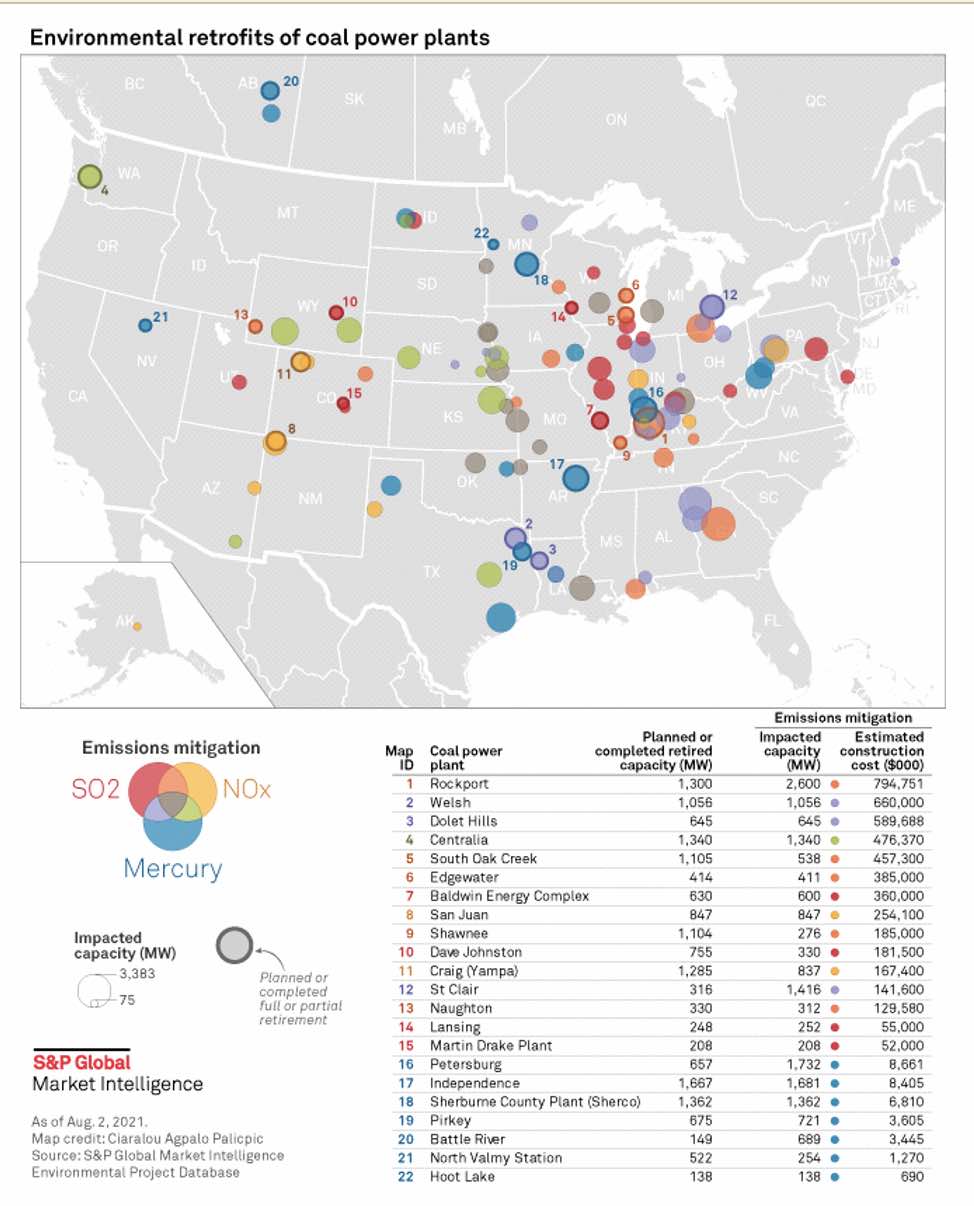
A total of 130GW of coal plants have already had environmental refits, mostly in the form of SOX and NOX scrubbing at a cost of $34 billion.
However, despite the refits, the coal plants are being retired due to economics and because there is no viable carbon emissions upgrade path. S&P currently lists 22 such plants planned for retirement.
Gas stranding likely to be a thing
Gas stranding has already occurred in California and in Texas. S&P cites the La Paloma gas plant that had a 2014 capacity factor of 73% and by 2020, when in receivership and facing carbon emissions costs, the capacity factor was down to 20%.
As the East Coast drives up its renewables share and the markets inter connect into the large (750 TWh) PJM, New York and New England regions, the energy will tend to depress price and volume below that required for long-term financial viability. And that’s the case notwithstanding that PJM operates mostly a capacity market.
The following figures taken from S&P are instructive for a number of reasons, not the least of which is the relatively low level of prices forecast.
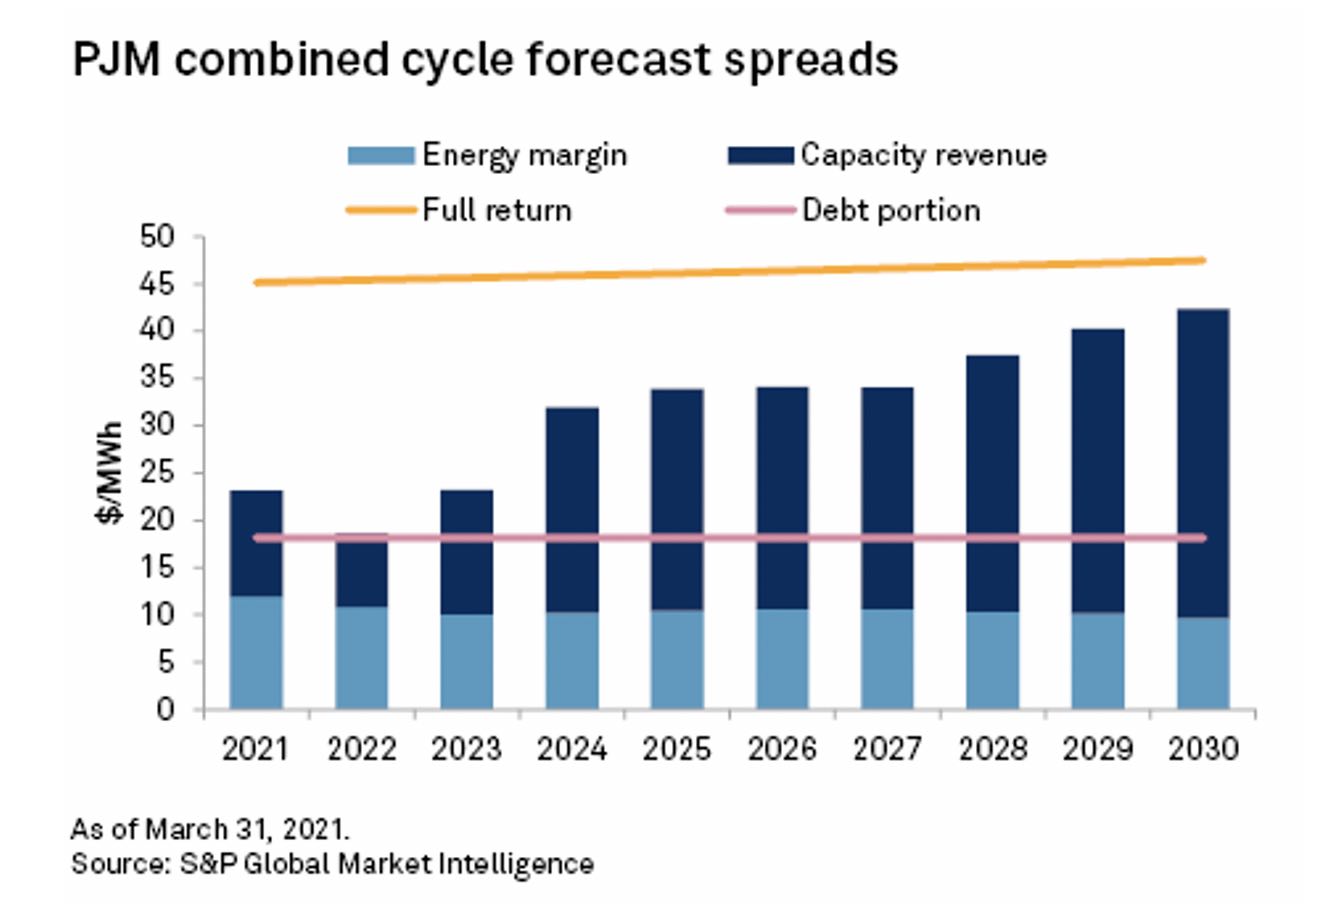
So Fig 6 shows that total revenue for a combined-cycle gas generator in the PJM is forecast to be around $30/MWh in 2024, enough to cover its debt cost but not to earn LCOE (estimated at about $46/MWh, yellow line).
In New York it’s worse; gas generators look like they won’t cover repaying debt and available revenue in the H2 of the decade falls below $10/MWh !!

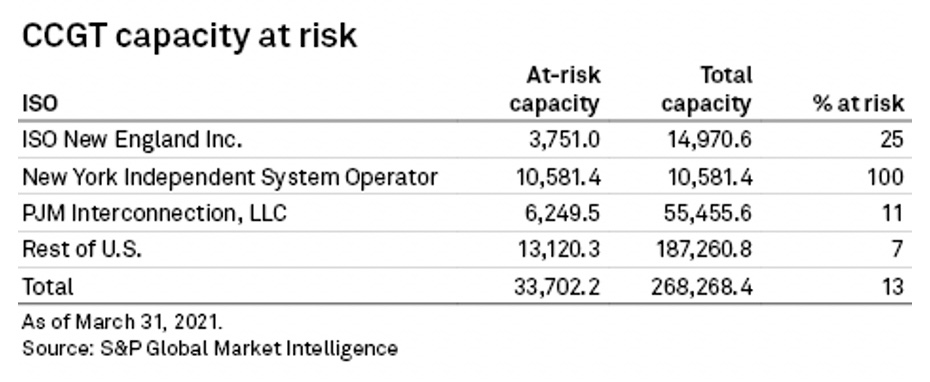
The result of all this is that S&P estimates that even under existing policies and conditions up to 20.6 GW or 13% of the current PJM, New York and New England CCGT fleet will be at risk by 2030 and 37GW across the entire USA representing maybe $34 billion of value.
ITK thinks it is more likely that this number will grow, rather than fall. For instance, should the national clean energy standard become legislation, CCGT capacity utilization would fall dramatically. (Dashed lines in figure below).
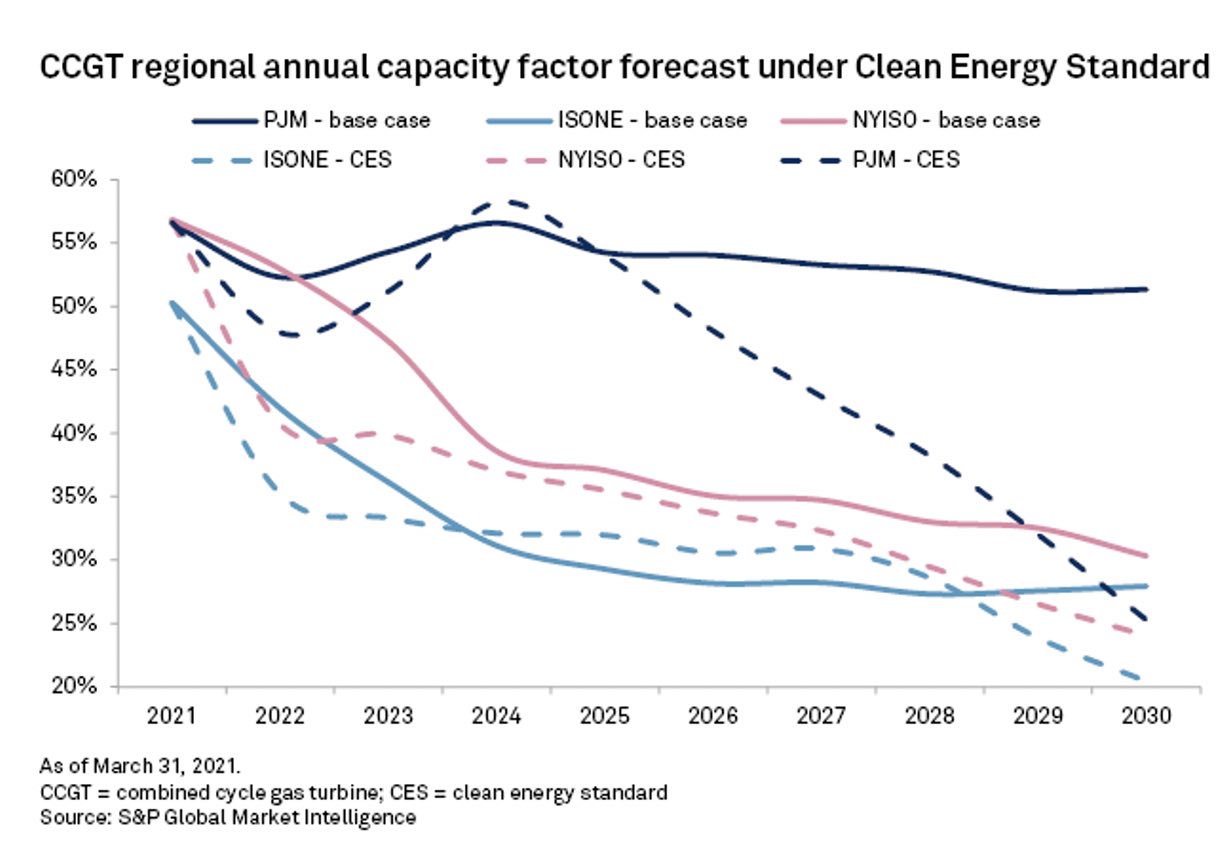
And in summary:
