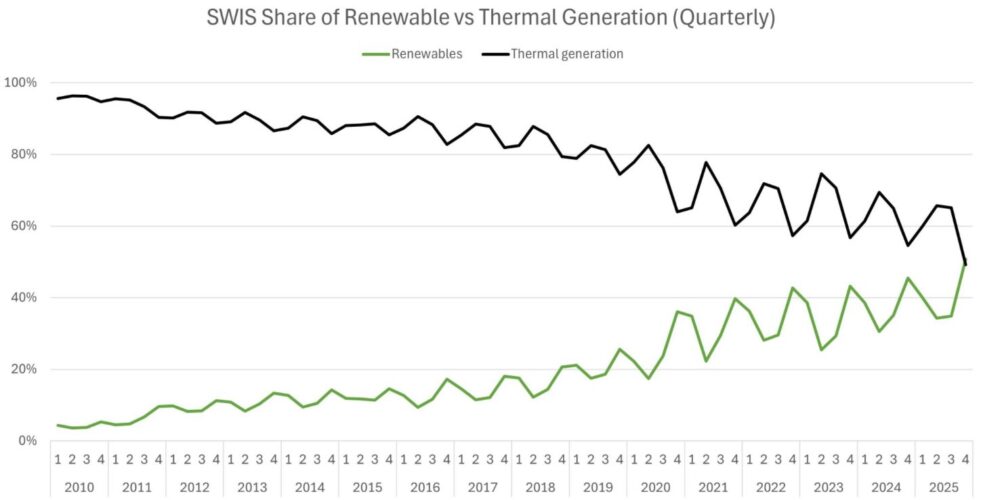
Here’s one statistic that might have been hard to predict – Western Australia, home to the world’s biggest isolated grid, is now outperforming the rest of the country in the transition to renewables.
Over the last three months W.A.’s South West Interconnected System has comfortably beaten the National Electricity Market, the country’s main grid, with a share of renewables of 50.7 per cent against 49.9 per cent for the NEM.
In the month of December, the share in W.A.’s main grid was 53.9 per cent, according to Rystad Energy, compared to 50.4 per cent for the NEM. Both are monthly records.
The fact that W.A. is outpacing the rest of the country is all the more remarkable because of the fact that its main grid is isolated, with no transmission links to other states or countries to export or import power when needed.
And it has no pumped hydro, or hydro of any sort, so its renewable share comes entirely from wind and solar, and its storage entirely from batteries – both household and grid scale.
It was not so long ago that W.A.’s main concern was the emerging solar duck curve in the middle of the day, courtesy of the huge uptake of rooftop PV in the capital city of Perth and regional towns.
Its isolated grid means that, unlike the interconnected South Australia, it cannot allow rooftop solar output to reach 100 per cent of local demand. South Australia reached that milestone on two consecutive days over Christmas, but it can’t be done in W.A.
The state has sought to flatten that solar duck curve with the rapid rollout of big battery storage, including the two biggest batteries in Australia (under current operating capacity), and both are located at the coal centre of Collie and each pack storage capacity of 2 gigawatt hours and more.
Jai Thomas, the co-ordinator of energy Energy Policy W.A., describes the progress over the last decade or so as resembling a crocodile’s head, with renewables now overtaking coal and gas, and with the state’s remaining coal fired generators expected to shutter by the end of the decade.
“With Transmission investments progressing and renewable energy developments under construction, this will only grow – much more to do, but great progress in the energy transition,” Thomas wrote on LinkedIn.
Those big batteries have helped reduce levels of potential curtailment, and it is no accident that the state’s wind and solar farms regularly feature as the best performing in the country.
According to Rystad Energy’s David Dixon, who issues a monthly report on the best performing wind and solar farms across the country, the three best performing wind farms in the country in the month of December were all in W.A.
The Badgingarra wind farm topped the list with an average capacity factor of 60 per cent – better than most coal fired power stations operation in the NEM – closely followed by Yandin (59.9 per cent) and Warradarge (56.4 per cent). The Collgar and Emu Downs wind farms, also in W.A., took fourth and fifth place.
The best performing solar farm in the country in the month of December was the Merredin facility, also in W.A., with a capacity factor of 45.2 per cent, followed by two facilities in NSW – Griffith and Moree – with capacity factors of 40.1 per cent and 39.7 per cent respectively.

According to Dixon’s data, solar farms in NSW accounted for 11 of the 20 best performing solar facilities in the country in December, and NSW became the first state to generate more than 1 terawatt hour (TWh) from utility scale solar in a single month.
In December, it generated 1.05 TWh from utility PV and a further 626 gigawatt hours (GWh) from wind energy. Total renewable generation across the NEM was 9.5 TWh in December. Curtailment levels were at 6.3 per cent for the month, according to Open Electricity.
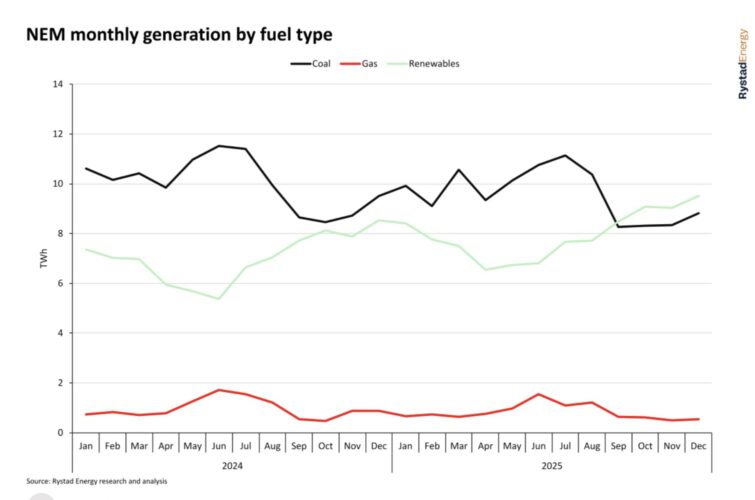
Dixon also notes that it was the eight lowest month of coal generation since the start of 2011, and the fourth lowest month of gas generation – a trend that will continue with the growth of household and grid-scale batteries.
Indeed, grid scale batteries increased more than three-fold in the past year in both the NEM and the SWIS, with NEM batteries discharging 248 GWh in December 2025, up from 68 GWh in 2024. Big batteries in W.A.’s main grid discharged 102 GWh, up from 32 GWH in December 2024.
Dixon says it was a monthly record (December) for the amount of hours of negative prices in all NEM states except Tasmania. The number of hours of negative prices for December reached 351 hours in SA (47% of the month), 290 hours in VIC (39% of the month), 189 hours in QLD (25% of the month) and 159 hours in NSW (21% of the month).
If you would like to join more than 29,000 others and get the latest clean energy news delivered straight to your inbox, for free, please click here to subscribe to our free daily newsletter.