The question is whether the National Energy Guarantee proposals by the Energy Security Board and the Federal Govt. will be accepted by the States. It is a question of fact as to whether they will or won’t and a question of opinion about the outcomes that will result if the proposals fall through.
We think there is a very arguable point of view, already supported by some evidence, that electricity prices will rise before they fall if the proposals are accepted.
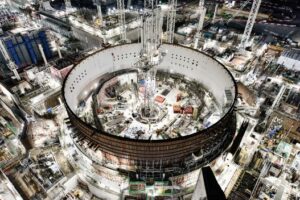
Why will they rise? Because that is the way the energy market works. New supply is going to be required in NSW as a result of plant closures.
In the market model, what happens is that investors or participants form views about supply, demand and prices and build or reduce supply accordingly.
In the most simple case when prices rise it provides a signal for new investment. So if say Liddell and Eraring in NSW are going to close it will lead to higher prices and then new investment. But it will also lead to a reduction in demand.
For instance electricity intensive businesses, such as for instance a data centre, or a bit coin mine, might see the forthcoming rise in prices and decide to close down their business.
Even if the price later falls as a result of new supply will that lead to the energy intensive business shifting back to Australia? Only with long lags. For an example see the aluminium industry in Australia.
Wouldn’t it be better to have a policy that foresaw that most of the generation fleet needs to be replaced and put in place policies to ensure new supply was forthcoming every year, preventing prices rising in the first place?
There can still be plenty of competition in the provision of that supply but once successful participants have revenue certainty and can finance the supply with a low cost of capital. This shifts some, but not all, risk from the private to the public sector.
We argue that in this particular environment the public sector is as well placed as the private sector to manage the risk. Many will not agree with this statement. But we see that reverse auctions, with Govt support are becoming the norm in many areas.
In addition the way the reliability guarantee is framed if a reliability problem is foreseen its AEMO that is ultimately responsible for procuring the new supply. This is defacto central planning.
The weekly numbers
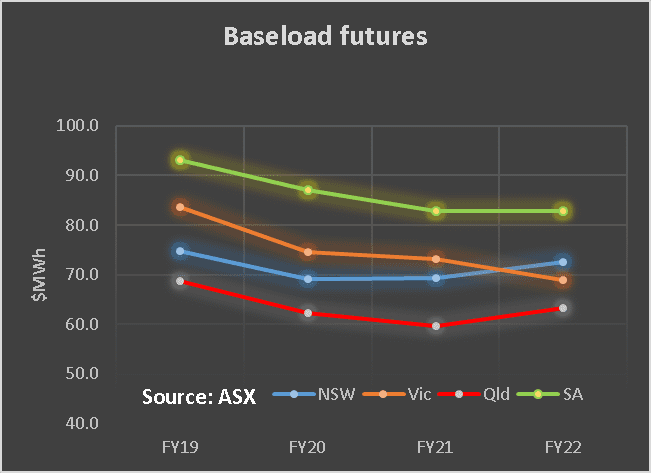
The ASX has started quoting FY 2022 baseload futures. These will hardly be traded but the quotes show that prices in Victoria are expected to fall and that NSW and QLD electricity prices are expected to rise in FY22. For the first time since Hazelwood closed, in that year, NSW futures are higher than Victoria.
We think that is one piece of evidence that could be used to say that Victoria is doing a better job than NSW at managing its electricity supply and there fore the electricity price.

Another thing to note is that South Australian futures remain above those of other States. South Australia has always had more expensive electricity but its disappointing to note that in a relative sense the South Australian premium is forecast to persist.
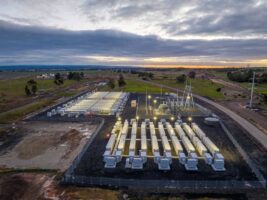
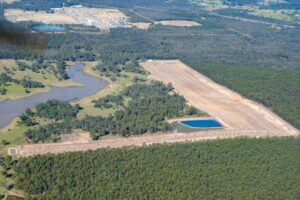
Not the wind, not the PV, not the potential pumped hydro, not the new gas station, not the battery seem to have any impact on the cost of base load power in South Australia.
LRET policy aims to reduce incentives for new renewable build
The second thing that’s interesting in the numbers is that out year REC prices have declined sharply in the out years. The ESB’s NEG documents make it clear that all new projects will be able to qualify for RECs.
This is a clear policy initiative designed to push the certificate price towards zero and reduce the incentive to new renewable energy projects.

Also of note is that electricity consumption due to hot weather in NSW was way up on last year for this week but electricity prices were contained. Gas prices continued to soften.

Oil prices rose to A$93 a barrel. This implys LNG export gas prices on long term contract basis of about A$ 11/ GJ not too far away from the prices on which the projects were justified.
Coal prices are A$120 /t. There is about .4t coal/ MWh so that implies a coal cost at spot for Japan quality export coal of around $48 MWh.
Actual full cost will be way higher than that by the time you factor in ancillary load, and other variable and fixed opex as well as the capital burden.
Australian 10 year bonds are lower than a year ago but USA bonds are up.

SHARE PRICES
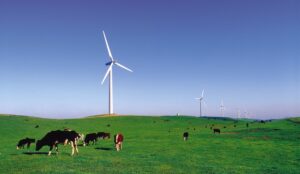
Wind shares have done well. Brookfield has shown up on the Infigen register and this will raise talk of further investment.
Lithium shares are going through some pain not helped by Orocobre having a poor quarter for quantity. Orocobre certainly doesn’t seem to be able to string two good quarters together in a row.
AGL shares are down 26% on a year ago without anything really happening to profits but ORG shares, on the back of higher oil prices as much as anything else are up 20%. That’s where fund managers, if they are lucky or clever, mostly lucky can make the big $.


Volumes

Base Load Futures, $MWH


David Leitch is principal of ITK. He was formerly a Utility Analyst for leading investment banks over the past 30 years. The views expressed are his own. Please note our new section, Energy Markets, which will include analysis from Leitch on the energy markets and broader energy issues. And also note our live generation widget, and the APVI solar contribution.