The Integrated System Plan is one of the most important documents to be released in Australia in many years. It sets out a 20-year blueprint for the renewable energy transition in Australia’s main grid, from the “central scenario” that takes us to 70% renewables by 2041, to the “step change” that gets us to more than 90 per cent.
Ambitious as that sounds – at least in the context of Australia’s political debate – it may have sold the energy transition short, because the reality is that deployment rates and cost falls are much higher than acknowledged in the document.
Relatively few organisations have bothered to make submissions to the draft 2020 ISP, but a few stood out.
Powerlink noted that in all probability, at least in the short term, the ISP has used numbers from CSIRO that have hopelessly underestimated how much behind the meter solar will be installed. They use Queensland as an example, but it would likely apply to most states. This is a basic problem with any forecasting document that is prepared over the course of a year when the market is moving rapidly.

I too have been guilty of underestimating how much behind the meter capacity would be installed, but having studied up on good forecasting practice and the art of judgement under uncertainty, I know to revise my forecasts whenever new information comes to hand – which in this case is every month with Warwick Johnston’s Sunwiz supplying timely monthly updates.
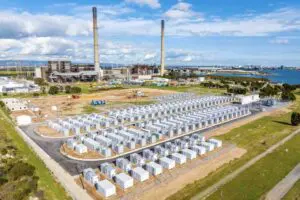
Along the same lines the two leading utility battery suppliers in Australia, Fluence and Tesla both pointed out that the ISP has a hopeless estimate both of battery costs and the quantity of batteries that will be installed.
Here is a quote from Fluence:
Figure 2.2 of the CSIRO GenCost 2019-20 draft report, under the most aggressive pricing shown, which was estimated by Aurecon in 2019, we believe the 1-hour, 2-hour and 4-hour duration pricing, are all roughly 40% higher than the price of what solution providers offer today ….
…. Looking at actual deployed projects shared on the ARENA website , we can see pricing for projects confirmed 2 years ago and can say with certainty how those prices have come down, due to a combination of declining component pricing (both batteries and balance of plant), new efficiencies in solution design, and greater familiarity with AEMO’s requirements for interconnection.
Lake Bonney: 25MW/33MWH cost $41.6MM= $1,664/kW or $1,260/kWh
Ballarat: 30MW/30MWh cost $19.93MM= =$1,507/kW or $1,507/kWh
Gannawarra:25MW/50MWh cost $41.6MM=$1,664/kW or $832/kWh
Here is what Tesla said in their submission:
“We are already observing AEMO’s forecast 2030 battery storage prices for projects occurring today.“
This statement shouldn’t really surprise anyone as it’s typical of what happens with new technology. Lithium batteries have been around for a long time, just like solar was, and then one day demand picks up and all of a sudden costs drop like a stone. Tesla also noted how fast batteries are coming in despite mainstream scepticism and despite economics that are still marginal only much less so.
-
“Tesla estimates that 240MW of grid-scale battery storage has already been commissioned in the NEM (with a strong pipeline of further MWs currently under construction, with financing decisions made, or publicly announced projects at varying levels of planning stages). In contrast, AEMO’s Draft ISP models 215MW of grid-scale battery storage declining to 110MW (as assets reach end of life and are not replaced with future projects) with no growth pipeline for any scenario “
In addition to those 240MW already deployed AGL has committed to a further 210MW, so we can be confident of getting to 0.5GW.
In short, this is what Angus Taylor’s technology solutions should be thinking about as opposed to some science fiction approaches to nuclear or carbon capture and storage. The technology solution has turned into a technology Palace Coup while Taylor and his majority are still looking for their breakfast hash browns.
In some respects the ISP was designed to be resilient to errors in input assumptions. Its “least regrets” approach which back in the day my very smart strategist at JP Morgan used to call “stochastic dominance” means that the ISP is building links that will still be required under many future states of the world.
24GW of daily storage is all that’s required for 96% of the hours in a year
How much storage is going to be needed for high renewable penetration? A good answer for that was provided by David Osmond from Windlab.
His presentation to the 100% renewable conference shows that for a 94% variable renewable NEM, and assuming that demand is similar to historic demand, you need 24 GW of 4 hour storage or more specifically 24 GW/81 GWh of daily storage of which 1.1 GW already exists in the form of exist pumped hydro.
On top of that you need another 4% of supply from either gas or longer duration storage, or by overbuilding wind and solar. Here’s David’s summary slide:

Unfortunately, studies of this sort don’t explain how we get from the present situation to the future state but this one specifically says we don’t even need all the transmission contemplated in, for instance, the ANU model of the world. So that’s progress.
From distributed energy to distributed storage to distributed control, the inertia of disruption – hello ARENA?
Here at ITK we’ve been jumping up and down for years about how long it takes to build transmission. It’s not rocket science.
But what is almost rocket science is transforming grid control. We will move from managing frequency, voltage and current using big spinning machines with all their inertia to a hierarchical, distributed network of interconnected micro grids. Australia with 2.2 m solar installations representing over 24% of total households is not only ideally suited but its an essential.
And again if this sounds like a technology driven solution then maybe Taylor is on the right track. Of course it also sounds like futuristic poetry spouted by someone with no real idea. And certainly I am no power engineer, but like any good analyst you work out who to talk to and what to read. Then you start writing like you know what you’re talking about. It’s good training for politics. Anyhow, I digress.
So my references for this concept of software managed grid forming inverters and batteries making up the control elements of hierarchically linked micro grids are:
Illinois Institute of Technology, workshop on Power electronics control of system
And low inertia grids, university of washington
If anyone is keen enough to look at the various papers from the first of those references you might find Mohammad Shadhidepour presentation which is the one I find easiest to look at for the overall topology. Two slides only:


The reference to transactive energy should surely fill John Pierce with love for the concept.
There are lots of interesting papers from those two workshops and it’s to be hoped that some one in Australia is doing similar work because Australia and the NEM has the most advanced program of DER in the world, by some margin, and inertia is going to keep falling. So this transformation will take even longer than building new transmission which is why we need to start right now.
In my view it’s an area that ARENA needs to get right on to.
One final slide that appears to explain the difference between grid forming and grid following inverters.

My guess, speaking as a financial analyst, is that P = real power, and Q = reactive power and Droop control is a method of frequency control by adjusting output active power of a controlled asset.
My final guess is that hierarchical control is about three levels, Primary control is the droop control used to share load between converters, Secondary control is responsible for removing any steady state errors introduced by droop control and Tertiary control is about more global responsibilities by using perhaps transactive energy to determine whether to import or export.
Back in today’s NEM, or at least last week’s
The global picture is one of a rapid decline in both oil prices and bond rates. Even five years ago you would probably have got odds of 20:1 of seeing today’s Australian ten year bond rate. Yet its now not beyond question it could go negative.
ITK distributed its Quarterly Renewables Wrap last week. In summary:
- There are now 15GW of wind and solar fully operational, undergoing commissioning, or being constructed with another 1GW committed. Of that:
6GW is in commissioning and 4.7GW is either being built or waiting to connect.
424 MW entered construction in the December quarter
ITK identifies 11 projects, over 2 GW, taking longer to build and or connect than in previous years.
In short, as we know there is a connection bottleneck but there is still plenty of supply to hit the market and impact prices and ramp rates. And of course behind the meter continues at its merry pace.
The oil price decline implies a fall in the contract export price for LNG from Qld. Of course the spot LNG market is also stuffed and so we saw spot gas sold on the Australian market last week with a $4 in front of it.

At the moment electricity prices look like they will fall significantly from their recent peaks but at least in the case of NSW futures are not back to the mid 2018 lows as yet. Still spot prices in most states are about half what they were last year for the calendar year to date:


Despite the bushfire induced spike, low consumption has been as much responsible for low prices as new supply.

AEMO induced curtailment of some solar and wind projects together with increased output from LYA has seen coal regain market share.


