What’s interesting this week, Hornsdale battery
It seems there is lots of interest in 100MW Tesla big battery in South Australia. Only 30MW of it tends to be used in the market at any one time. We estimate that 30MW earned a little over $1.3 m of revenue in January todate with over $1 m being earned on the 18th and 19th January.
The median daily output is about 100 MWh and the median price $109MWh. We get this data from NEM Review ( where would we be without it?).
On 18 Jan average price received was $6,869 MWh and over $4,000 MWh the next day. $1.3 m is good money but recharging costs have to be accounted for, which we can’t see, and also relative to a 100 MW/$100m investment wouldn’t get you too excited.
However, relative to the 30 MW/$30m capex that seems to be deployed in the spot market, $1m a month of revenue would be exciting. Still, we don’t expect too many days where prices of $6,000MWh will be available, and of course if they were expected to occur regularly we would soon see more batteries.
What it does show, though, is that the volatile South Australian market does have some merchant opportunities for utility scale batteries, in contrast to other markets. It also shows that 30 MW operating virtually every day.

Here at ITK we never had the slightest doubt the battery would operate reliably, be installed quickly and do a fantastic job at frequency response.
However, we still think its behind the meter batteries that could make the biggest difference to the Australian market and we keep looking for some more signs of prices coming down and available quantities going up.
As noted elsewhere at Reneweconomy, wind farms and PV farms are increasingly opting to include some battery firming. Even the ability of a solar farm to push its energy two hours back to capture current peak prices in say Qld could be quite economic.
We think we will see 1 GW of batteries deployed in Australia long before we see either 1 GW of pumped hydro or 1 GW of concentrating solar. The batteries may be more expensive on a $MWh basis once you get beyond 1 hour’s storage but this is looking at them in isolation.
If you have a portfolio of batteries each with just 1-2 hours storage, quickly installed, in front and behind the meter you are going to put a lot of flexibility into the system. Behind the meter storage tends to be of relatively long duration (6-10 hours) so can dramatically impact household peak consumption and prices.
Market action – 8% higher consumption, spot prices down 44%
Electricity consumption rose 8% in the week to Jan 26 compared to the previous corresponding period, despite Australia day, which up 7% in NSW and a whopping 19% in Victoria.
These increases were driven by hotter weather and in Victoria also we expect full output this year from Portland smelter.
Despite the hotter weather across the NEM spot prices were on average down on last year mainly because this year prices in QLD averaged $91 MWh and this week last year they were over $400 MWh
Despite the loss of Hazelwood, the hotter weather, and the resumption of Portland spot prices in Victoria averaged just $80 MWh up from last year’s $60 MWh but still an excellent outcome.
Of course it’s far too early to declare that we will get through Summer without drama but so far its been as good as or better than could be expected.
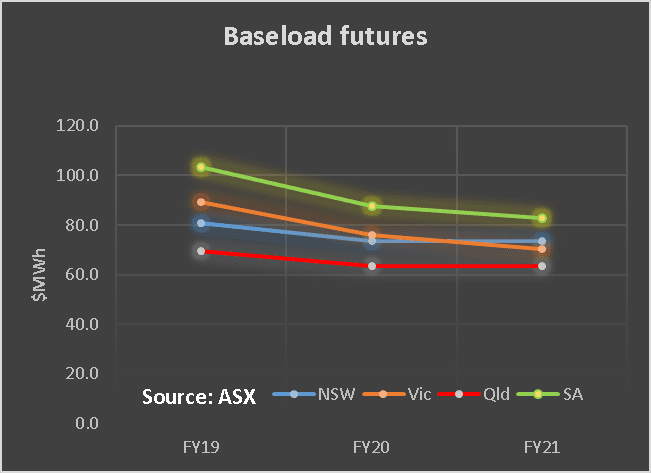
Futures prices were slightly softer but not enough to indicate anything more than a lack of interest.
The 30 day moving average of spot gas prices is almost identical to last year although on the week NSW prices were up at over $10 GJ and down in Victoria and South Australia.

We continue to see bond yields rising, and Australian yields are rising faster than in the USA and this is helping push up the A$. So despite coal and oil prices in US$ being up 9% year on year in A$ terms its just 3%.

Share prices
Investors have reacted positively to Redflow’s communication of progress on their new factory in Malaysia and lithium shares recovered modestly from the prior weeks setback.
Origin over the past 12 months has moved from the 3rd largest utility by market capitalization to the largest at $16 bn just edging out AGL at $15.4 bn.
Yield based utilities continue to struggle as yields rise. Rising interest rates mean lower prices. Regulatory allowances which compensate investors for changes in market conditions tend to lag the real world. This worked in investors’ favour when rates were falling but against them at the moment.


Volumes

Base Load Futures, $MWH

Gas Prices


David Leitch is principal of ITK. He was formerly a Utility Analyst for leading investment banks over the past 30 years. The views expressed are his own. Please note our new section, Energy Markets, which will include analysis from Leitch on the energy markets and broader energy issues. And also note our live generation widget, and the APVI solar contribution.


