Know your NEM: New capacity casts a long shadow

In the past week we added another 650MW of projects to the pipeline of “under construction” utility-side variable renewable projects, consisting of the two Innogy PV farms in NSW and 115MW Granville Harbour wind in Tasmania.

Excluding the now “old hat” 800MW of Hornsdale, Ararat, Kiata and White Rock wind and Kidston PV, ITK’s spreadsheet still has 3.3GW of wind and 3.4GW of PV as either commissioning, under construction or certain to proceed.

And there is still, at a minimum, another 650MW from the VRET auction. Without listing the individual projects, Fig 1 shows a total of 7.1 GW. Of course, these numbers also exclude the behind-the-meter PV, probably 3GW between say Jan 2018 and Dec 2020.

Figure 1 New capacity by State & Fuel. Source: ITK

It’s incredible how little attention this gets from the mainstream media. And yet, on the other hand, it’s also fair to say that the new projects are mostly fairly slow coming on line.

Frankly, here at ITK, we significantly underestimated how long it takes a new PV plant to go from initial energisation to full production, and to some extent the same is true for wind.

And this is a typical problem in forecasting – it’s the difference between what you can observe today and what you know will happen in the future. New capacity casts a long shadow.

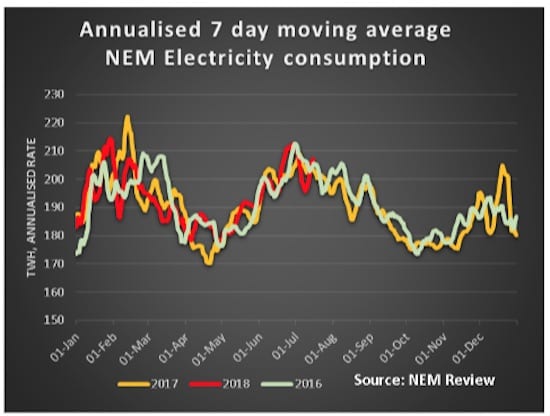
Converting the above capacity into energy, assuming about a 38 per cent capacity factor for wind and about a 28 per cent for PV, coal at 85 per cent and the gas reciprocating firming power at say 15 per cent, what I get is about a 10 per cent increase in energy supplied.

In NSW, this still won’t replace Liddell, let alone the other coal stations, but everywhere else there will be a net increase. A short-hand assumption is the increase in behind the meter cancels energy demand from ongoing population growth.

So, in front of the meter demand is basically flat. Lower prices will increase demand, and that’s another reason why a carbon price is a good idea. … I’ll get my hat.

Figure 2 Supply increasing 10%. Source: ITK

At zero marginal cost and with the exception of some potential wind curtailment, the new supply will find its way into the market and impact price. Keep watching this space. All that said, the impact of new supply on spot prices today is largely invisible. And that’s the crunch.

The market action –

Spot prices spiked heavily in South Australia, gas prices rose and electricity futures fell.

Internationally it was a quiet week, but coal prices continued to rise. Utility shares negatively exposed to the ACCC report took a hit – and that includes wires and poles shares which also received a blow from the AER’s WACC review.

The AER’s decision that beta is 0.6 and the Market risk premium is 6 per cent are entirely reasonable choices. We’ve been using a market risk premium of 6 per cent for more than 20 years and lower interest rates if anything would drive it down.

Figure 3: Summary
Figure 4 Cap prices. Source: NEM Review
Figure 5: Commodity prices. Source: Factset


Figure 6


Figure 7: Weekly and monthly share price performance
Figure 8: Electricity volumes

Figure 13: Baseload futures financial year time weighted average

Figure 15: STTM gas prices


David Leitch is a regular contributor to Renew Economy and co-host of the weekly Energy Insiders Podcast. He is principal at ITK, specialising in analysis of electricity, gas and decarbonisation drawn from 33 years experience in stockbroking research & analysis for UBS, JPMorgan and predecessor firms.

Comments

12 responses to “Know your NEM: New capacity casts a long shadow”

  1. Brad Avatar
    Brad

    The following 141 MW of solar and 130 MW of wind capacity is also in the works in WA:

    Merredin Solar Farm 100 MW (assigned Capacity Credits for 2019-20, WEM ESOO 2018 https://www.aemo.com.au/-/media/Files/…/WEM/…/2018-WEM-ESOO-Report.pdf)

    Greenough River Solar Farm Stage 2 30 MW (Committed under LRET supply data http://www.cleanenergyregulator.gov.au/DocumentAssets/Pages/Power-stations-and-projects—committed.aspx)

    Northam Solar Farm 11 MW (assigned CCs for 2019-20)

    Badgingarra Wind Farm 130 MW (assigned CCs for 2019-20)

    1. David leitch Avatar
      David leitch

      Thanks Brad. Someone was asking about WA the other day and Google didn’t show much. Great pv and wind resource over West.

    2. Steve Applin Avatar
      Steve Applin

      Don’t forget Cunderdin Solar Farm (100MW) which is on track to be finished Q3 2018.

      1. Brad Avatar
        Brad

        I only included projects where I’ve found solid evidence that they’ll progress, rather than relying on company projections on websites such as Sun Brilliance that haven’t had information updated in over six months “financial close is expected in November, 2017” or potentially outdated news articles.

        If you have a more recent source that Cunderdin is progressing as planned could you please post it below.

        Other projects in the pipeline that haven’t been mentioned include:

        Flat Rocks Wind Farm Stage 1 – 40 MW
        Flat Rocks Wind Farm Stage 2 – 90 MW
        Waddi Wind Farm – Up to 105 MW
        Warradarge Wind Farm – 180 MW
        Yandin Wind Farm – Up to 300 MW (One news article said 210 MW)

        Badgingarra Solar Farm – 17.5 MW
        Byford Solar Farm – 20 MW
        Flat Rocks Solar Farm – 10 MW
        Waddi Solar Farm – 40 MW

        Badgingarra Battery Storage – xxMW/50MWh

        Interestingly, many of the projects will be Solar+Wind if all stages are completed.

        1. Steve Applin Avatar
          Steve Applin

          I asked Ray Wills from Sun Brilliance on Twitter if it was still on track for Q3 2018 and he said yes.

          Flat Rocks stage 1 is under construction and Warradarge Wind Farm has FID from Synergy as part of the deal they did to carve out their renewable assets.

          Yandin was due for FID from Alinta earlier this year, I haven’t seen any confirmation of it though.

          Byford Solar Farm has a PPA, has appointed an EPC contractor and completion was supposedly mid 2018. I work nearish to there but haven’t had cause to drive past.

          1. Brad Avatar
            Brad

            That’s good to hear. Thanks for the update.

          2. Steve Applin Avatar
            Steve Applin

            Bad news on the Byford Solar Farm. I drove past past the block of land that it’s proposed to be on (between Abernethy Rd, Thomas Rd and Preverett Ln in Oakford) and there are no signs of construction activity of any kind.

  2. Peter F Avatar
    Peter F

    David I suspect your 38% for new wind is a bit pessimistic as some of the new farms are reaching 48% I would use about 42- 44%. Also I think while rooftop was running at 800 MW or so per year that would offset population growth, but now it is running around 1,500 MW, you can probably say it will reduce grid demand by about 0.5-0.7 TWh per year. To the end of 2022 that is almost half Liddell by itself.
    The total new generation including your numbers + Aurora if it happens is about 13% increase in supply by the end of 2020.
    A 13% increase in supply in a static market will have a pretty dramatic effect on prices

    1. trackdaze Avatar
      trackdaze

      13% increasing in supply assumes no coal is mothballed or retired due to failure or cost prior to 2022.????

  3. Steve Applin Avatar
    Steve Applin

    “And yet, on the other hand, it’s also fair to say that the new projects are mostly fairly slow coming on line.”

    I’m a project accountant and have been involved in construction for 15 years. Speaking generally, proposed/planned project timelines are always *very* optimistic and commissioning almost always takes considerably longer than initially expected.

    1. David leitch Avatar
      David leitch

      Steve

      I have to agree. My rule of thumb is that project NPV is at a maximum when presented to Board for approval. What I meant in this case was that PV projects are taking longer to go from first energisation to full capacity than I expected.

      regards

      1. Steve Applin Avatar
        Steve Applin

        Utility scale PV does need to be commended on its ability to achieve practical completion of the construction component of the project on time & budget, something that is unusual in large scale construction projects.

Get up to 3 quotes from pre-vetted solar (and battery) installers.