Policy outlook
Now that Finkel is out and it can be analysed as the political animal that it is our focus turns to matters of more immediate impact.
- Victorian reverse auction scheme. Time is running short for legislation is this is to be introduced. We see it as an important line in the sand that sets a minimum for what’s needed not just to decarbonise but help with lower prices and energy security in Victoria.
- We need to do some more work on this but the annual transmission planning documents from AEMO are due shortly. In its submission the CEFC stated:
“For the 2017 NTNDP, the CEFC encourages AEMO to explore the following areas in detail: synergistic benefits of multiple interconnectors; opportunities for transmission investment that unlock least-cost renewable energy resources; addressing institutional impediments to improved coordination of multiple interconnector investments; a ‘statement of opportunities’ for demand management; limitations of modelling tools and capabilities to assess investment in new technologies; and the choice of discount rates for the purpose of economic analysis undertaken for the NTNDP”
It’s becoming clear that the potential of utility scale renewables is going to be held back if we don’t shortly get on with:
1 More transmission in North West Victoria.
2 More transmission in the West, South West and probably North East of NSW
3 More transmission to South Australia
Distributed generation formed into resilient street and community level micro grids is the way forward on the fringe of the grid but centrally we need some big pipes to enable more utility scale renewables to be built.
Turning to the weekly action
- Volumes: Essentially flat, ticked down in Victoria marginally up in Qld and NSW
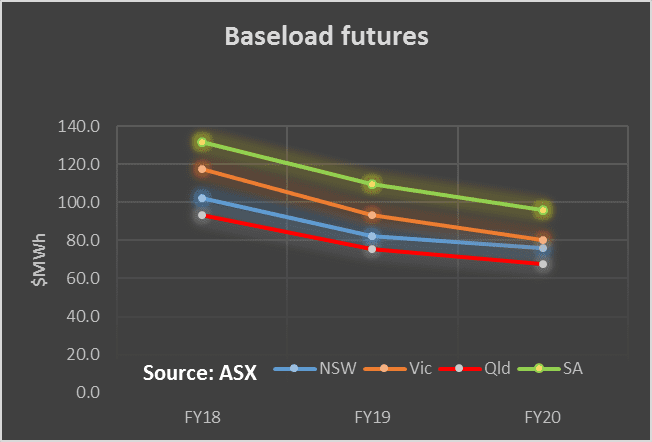
- Future prices fell again in all States. The downtrend is now firmly established and prices in the out years are significantly lower than in 2018. That’s particularly noticeable in Victoria
- Spot electricity prices basically have softened. It’s shoulder or early winter in Qld and spot prices were down around the $60-$70 MWh and this flows into NSW. There were brief spikes three days in a row in Tasmania which threw out the national average
- REC
- Gas prices . Despite the increased use of gas for generation this year compared to last we are not yet seeing the same Winter gas price spike that we saw last year. That may yet occur but the cynic says that with gas prices under great scrutiny we are seeing a deliberate attempt to keep them in check.
- Utility share prices were generally softer than the broader market. Falling oil prices didn’t help and some talk of higher interest rates possibly hurt the rate sensitive sector.

Share Prices


Volumes


Base Load Futures

Gas Prices


David Leitch is principal of ITK. He was formerly a Utility Analyst for leading investment banks over the past 30 years. The views expressed are his own. Please note our new section, Energy Markets, which will include analysis from Leitch on the energy markets and broader energy issues. And also note our live generation widget, and the APVI solar contribution.


