What’s interesting at the moment.
10 Year bond rates rose during the week ended January 12, up 18 bps (basis points) in Australia and 15 bps in the USA. This is concerning to renewable energy financiers. Only last week we were saying the change didn’t make much of a difference, and it still doesn’t.
Still we don’t like the trend.
We are adding a new table to “Know your NEM” with a few key non electricity and gas variables. We will add in the lithium price in due course. The new table looks as follows right now:

So far, despite thermal generator outages, the system is coping
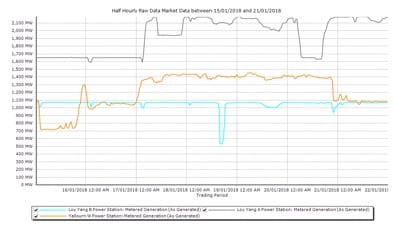
Nothwithstanding some high prices caused by the Loy Yang B outage the system coped OK last week. Our learnings are as follows:
- The 8 thermal coal generators and maybe 28 units of those generators in NSW & Vic continue to have reliability issues that will only get worse. To me it’s astonishing that the AEMC doesn’t seem to understand this issue one little bit. Its “Draft Frameworks Review” two hundred and something pages published in December 2017 preferred to focus on the AEMO’s demand forecast record and whether the contract market was working. There is just so much wrong with the AEMC at the moment it’s hard to know where to start, but we’ll get there.
- South Australia is the State that gets squeezed when Victoria has a problem
None of this is surprise. Each of the Victorian brown coal generators only ran at full capacity for part of last week.
We actually agree with energy minister Josh Frydenberg in that if Snowy 2 had been up and running it could have assisted. But it needs a lot of those events to justify Snowy 2.

Turning to the weekly action
Despite some warm weather consumption across the NEM was down, driven down by lower consumption in NSW and QLD only partly offset by much higher consumption in Victoria and South Australia. For the CYTD consumption across the NEM is flat.
Note that our consumption measure excludes behind the meter solar
Futures prices for both FY19 and FY20 fell, particularly in NSW but also in other States except South Australia
Gas prices are essentially flat on last year. Gas generation in South Australia and Victoria is actually down a touch in total for January to date on last year. So that no special call on gas volume has been needed.
Share prices were weak across the board typically underperforming the ASX 200 which lost 1%. Lithium shares took a cold shower on the news that Chile and the world’s largest lithium producer SQM have reached agreement on expansion of SQM production.
Notwithstanding that news and despite the pessimism of many in the Investment banking research community we are hopeful demand for lithium can keep up with supply.
Almost any amount of new supply. Still lithium prices, although only a small part of the battery cost will need to come down in time.

Share Prices


Volumes

Base Load Futures, $MWH


Gas Prices


David Leitch is principal of ITK. He was formerly a Utility Analyst for leading investment banks over the past 30 years. The views expressed are his own. Please note our new section, Energy Markets, which will include analysis from Leitch on the energy markets and broader energy issues. And also note our live generation widget, and the APVI solar contribution.

